Your acquisition report shows where customers came from. Connecting those sources to retention and NRR helps you see which accounts stay and grow. That requires a fair comparison: paying accounts at the same customer age, with one clear source rule and consistent revenue definitions.
CAC gives SaaS teams a clean number to work with. But anyone who has sat through a churn review knows the story can change fast.
One source may bring in customers at a lower cost. Another may bring in accounts that stay longer and expand. To compare them fairly, your team needs more than a channel report.
Marketing knows how the customer arrived. RevOps connects the account records, Finance tracks the revenue, and Customer Success sees how the account progresses.
Put those pieces together with product usage, and your team can see what happened after the sale.
Let’s break down how to join those records, build comparable cohorts, and calculate GRR and net revenue retention (NRR). Then we’ll check what could explain the gaps before your team changes acquisition spend.
Define the account, source, and cohort you will measure
First off, start with the basics: decide what counts as one paying account and which source gets credit for bringing it in.
This sounds simple, but one company can have several contacts, workspaces, and subscriptions. Those contacts may arrive through different campaigns. Without clear rules, your team can count the same customer twice or assign its revenue to the wrong source.
So, set those rules before you compare results. For this guide, a cohort means a group of paying accounts that share an acquisition source and a first-paid month or quarter. We’ll compare their results at the same customer age.
Choose and preserve one acquisition-source rule.
You don’t need perfect attribution to start. You need enough consistency to compare cohorts later.
Pick one rule for the analysis and document how your team applies it. For example, you could use the account’s earliest recorded acquisition touch. Keep first-touch and last-touch fields as separate context:
- First touch: The earliest recorded interaction that brought a contact into your funnel.
- Last touch: The final recorded interaction before a defined conversion, such as the first paid subscription.
For our example, we’ll use the earliest known acquisition touch across the contacts linked to the account. We’ll call this its original source. Record both the channel and the campaign, where available.
Let’s say one contact first arrives through a partner campaign. A colleague later clicks a paid search ad before the company subscribes. Under this rule, the account keeps the partner campaign as its original source. Paid search remains part of the account’s history.
Keep that historical source fixed after the account becomes a customer. Store later campaign interactions separately so a renewal email or expansion campaign cannot overwrite it.
If your records lack a source, place the account in an “unknown” group. Keep its accounts and revenue visible, and report how much of the cohort lacks source data. Don’t fill the gap with an unsupported channel label.
Map contacts, workspaces, and subscriptions to paying accounts
Now decide which records belong to the same customer.
Use one stable account_id for each paying account. Link its contacts, workspaces, and billing subscriptions to that ID. A company with five contacts and three workspaces can still count as one account.
For example, one customer might have two subscriptions across separate workspaces. Add their recurring revenue under the same account ID. Don’t count each workspace as a separate acquisition.
Your mapping rules should cover:
- Multiple contacts: Link each contact to the right account. Apply your source rule across those contacts.
- Several workspaces or subscriptions: Map each record to its paying account before you total revenue.
- Duplicate CRM records: Resolve duplicates under one account ID.
- Merged accounts: Keep a record of the old IDs and their dates. Check historical totals so the merge cannot duplicate revenue or erase churn.
Separate contracts or billing arrangements may justify separate analysis accounts. Document that choice and apply it across all sources. A shared company name alone does not establish the right grouping.
As the account moves into onboarding, renewal, expansion, or churn, your team should still know where it came from and which revenue belongs to it.
The key rule: count each paying account once within a cohort.
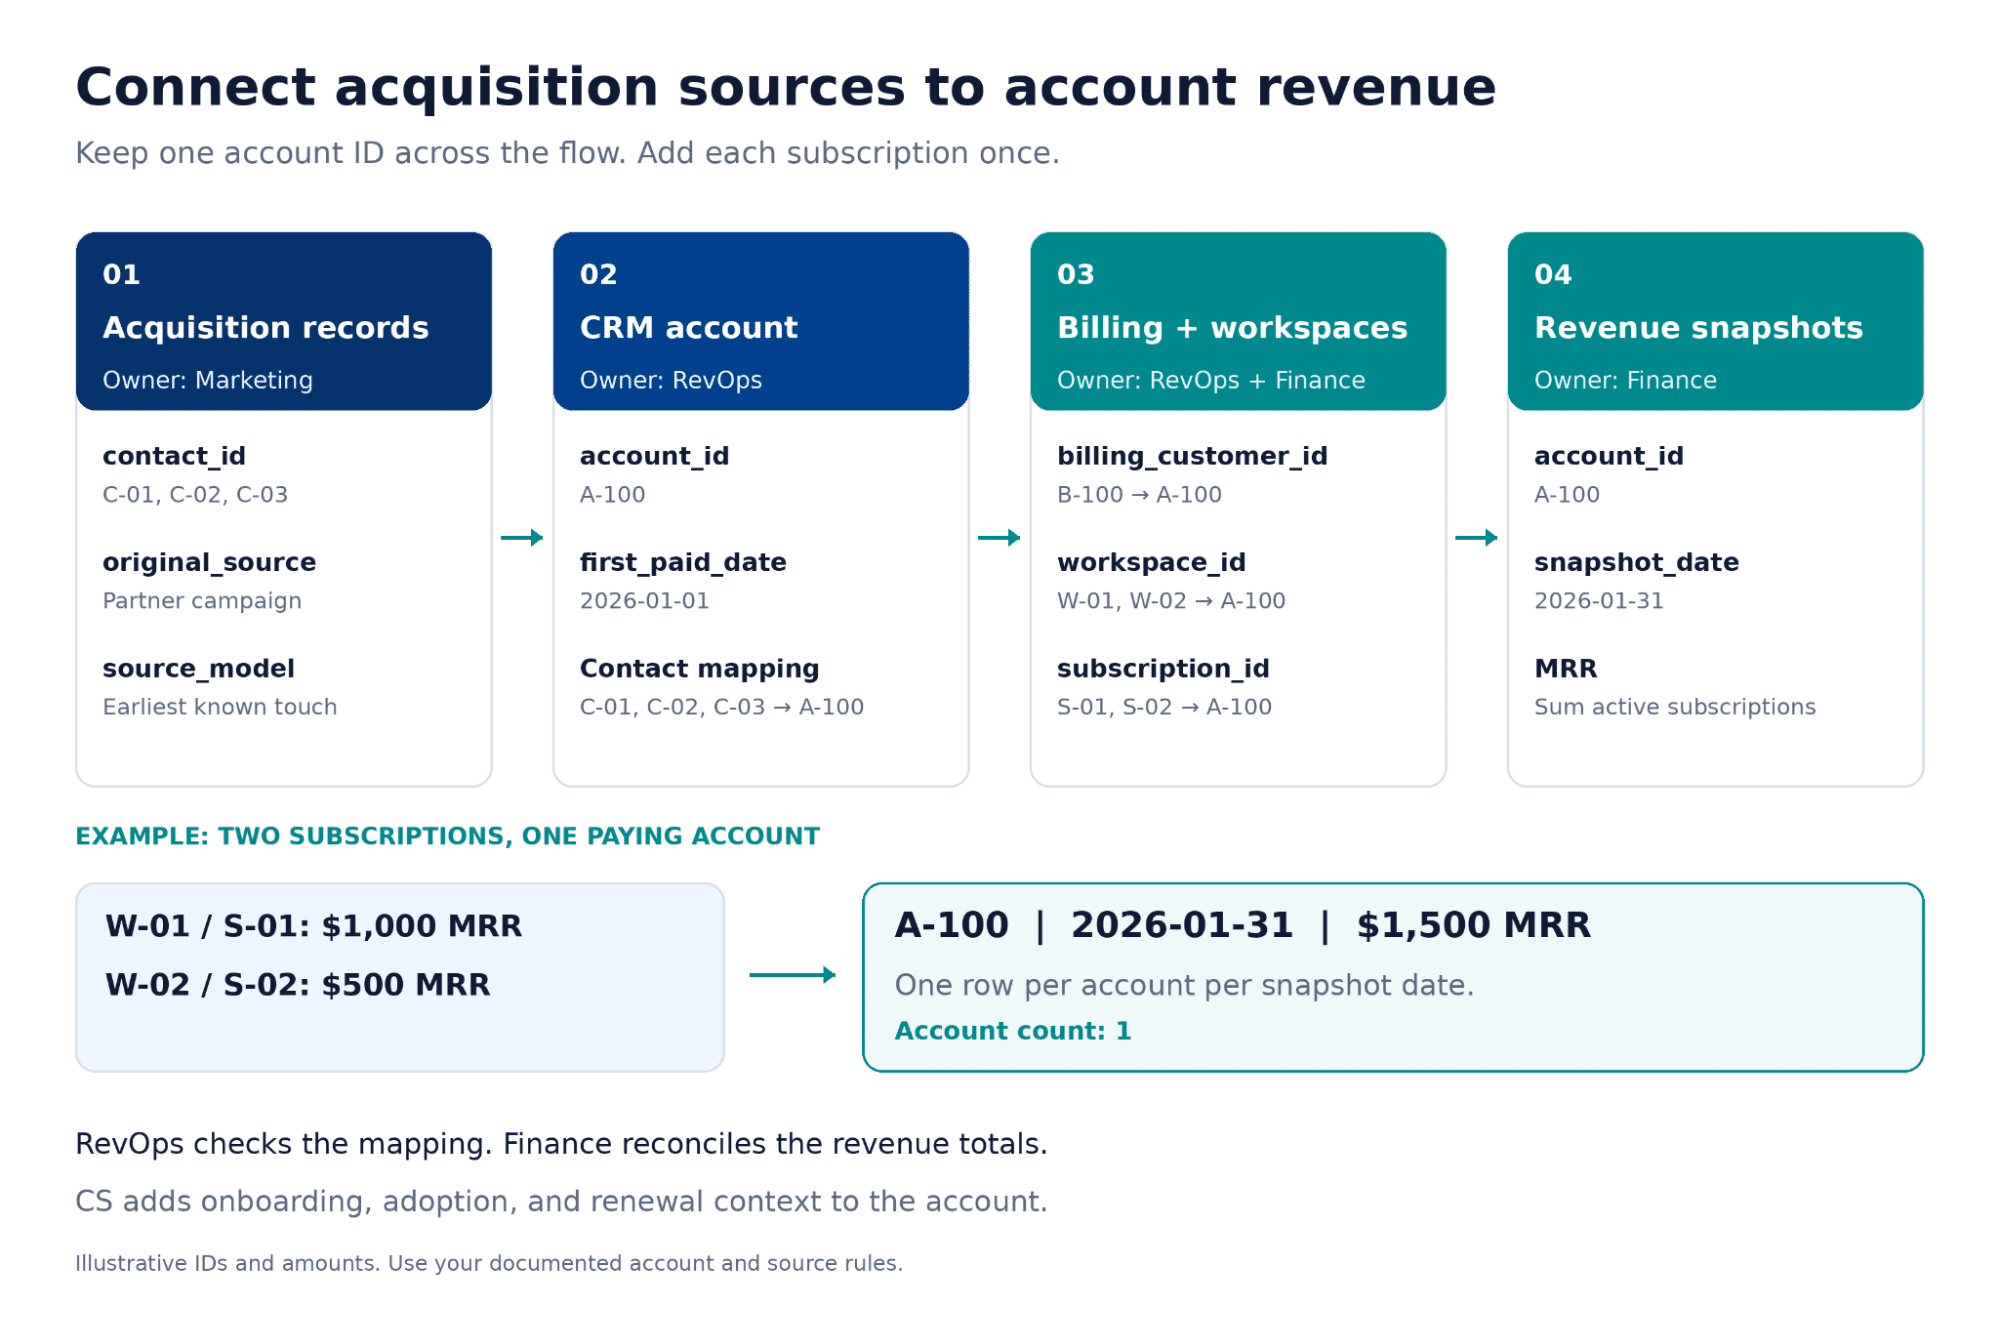
Join acquisition data to recurring-revenue and CS records
Once source data reaches the CRM, connect it to the records that show how the account performs.
The CRM gives you account context. Billing tracks recurring revenue. Product usage and Customer Success add activation, onboarding, and renewal context.
But naming those systems only gets you so far. Your team needs a clear way to join their records without losing accounts or multiplying revenue.
Minimum fields and system owners
Then, start with a small set of fields your team can trust. Each field needs a clear definition and an owner:
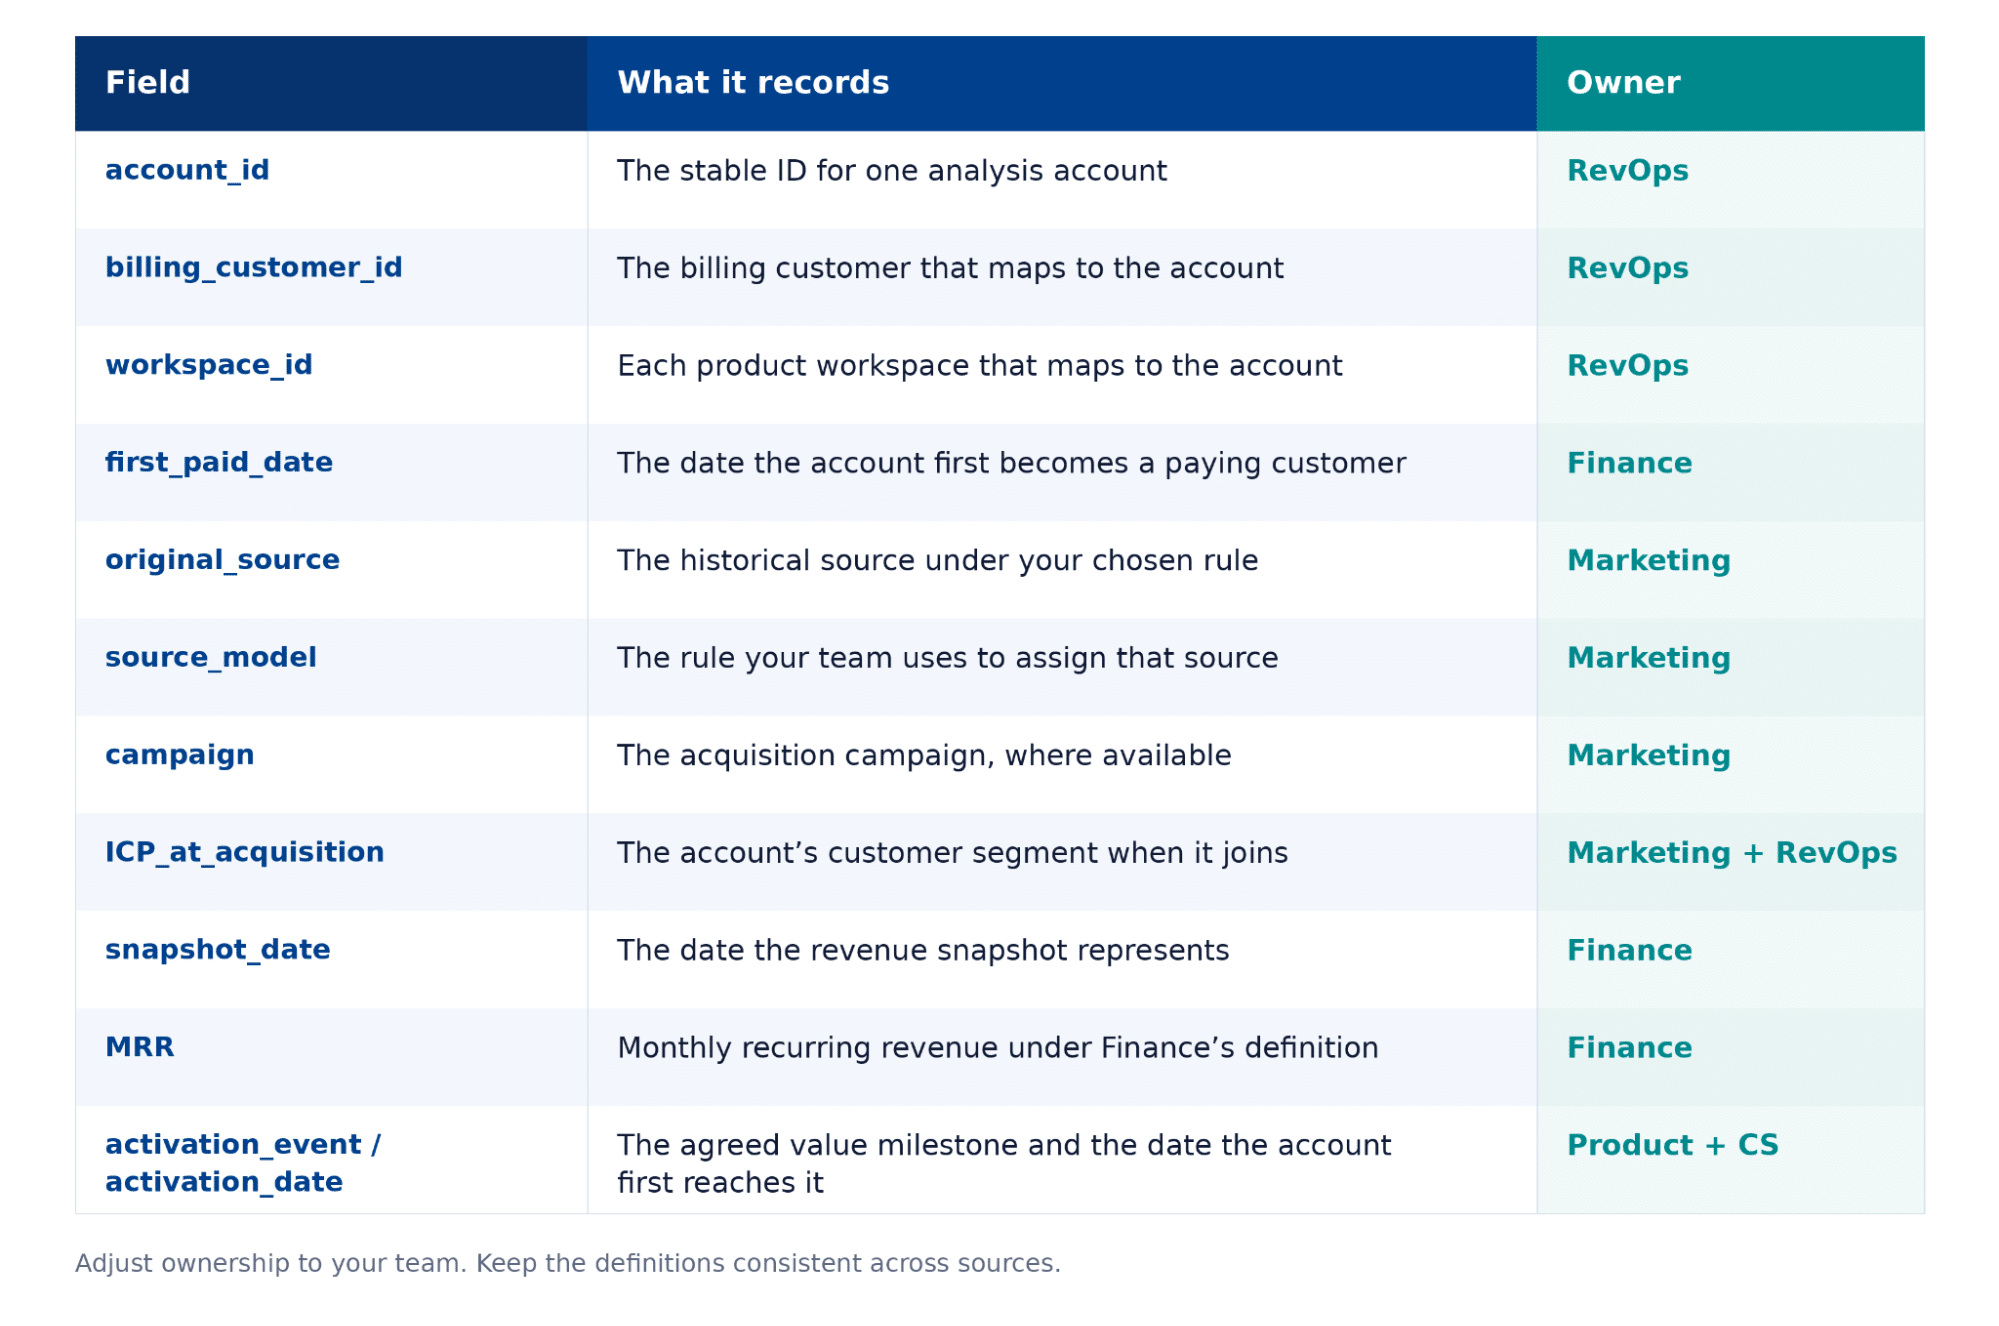
Define activation around a specific product action. For a workflow tool, that could mean two team members complete their first shared workflow. Keep the same event definition across the cohorts you compare.
Finance should also document the MRR rules. For example, divide an annual recurring subscription fee by 12. Exclude one-time setup fees and taxes. Apply the same rules for discounts, currency, and subscription status across every source.
Then build the join:
- Map each billing customer and subscription to account_id.
- Total subscription MRR for each account on each snapshot_date.
- Add the account’s source, campaign, first-paid date, and original ICP segment.
- Add activation and CS metrics at the account level for the relevant period.
Keep subscription IDs in the mapping records so your team can trace each revenue total.
The final revenue table should have one row per account per snapshot date. Keep contact and workspace details in separate mapping tables.
Reconcile missing and duplicate records
A join can look clean and still produce the wrong total.
Let’s say one account has three contacts and two subscriptions. Joining every contact directly to every subscription creates six rows. If your report sums those rows, it counts each subscription three times.
Total revenue at the account level first. Then join it to one account record and any account-level product or CS summaries.
Before you calculate retention, check:
- Billing IDs without an account: RevOps resolves the mapping. Keep unresolved revenue visible in an exception report.
- Duplicate CRM accounts: Map duplicate records to one stable ID before the join.
- One-to-many mappings: Confirm that each subscription belongs to one analysis account on the snapshot date.
- Missing source values: Keep those accounts in the “unknown” group.
- Missing snapshots: Investigate the gap. Don’t turn missing data into zero revenue and call it churn.
Finally, Finance should compare the account totals with the billing totals for the same date and scope. Explain any exclusions or differences, and resolve them before comparing sources.
Once those totals agree, your team can build cohorts from records it can trace and check.
Calculate retention and NRR for comparable source cohorts
With the records in place, your team can compare what each source produces after acquisition.
GRR shows how much recurring revenue the cohort keeps before expansion. NRR adds expansion to that picture.
Both calculations follow the same set of accounts from a defined baseline. New customers cannot enter halfway through and make retention look stronger.
Align first-paid dates and observation windows
Group accounts by their first-paid month or quarter, then split those groups by acquisition source.
But a shared signup period alone does not make the comparison fair.
Your team also needs to measure each account at the same customer age.
For example, use each account’s MRR at first payment as the baseline and its MRR six calendar months after that date as the endpoint. Keep every paying account in the original cohort, including those that churn in the first 30 days.
This gives each account the same six-month observation window without excluding early churn. If your team also wants to measure retention from day 30, label that view as retention among day-30 survivors and report early churn separately.
Each source cohort should show:
- First-paid month or quarter.
- Account count at baseline.
- Baseline and endpoint ages.
- Starting recurring revenue.
An account that churns during the window still belongs to the baseline cohort. Keep it in the calculation with zero recurring revenue at the endpoint.
If some accounts have not reached six calendar months since first payment, leave that cohort’s month-six result blank. Don’t compare a partial window with a complete one.
Worked GRR and NRR example
Here’s a hypothetical comparison of two January acquisition cohorts. Each contains 80 accounts that made their first payment in January. We compare each account’s MRR at first payment with its MRR six calendar months later, keeping accounts that churn in the calculation.
The amounts below represent MRR at those two points, so they are not cumulative revenue over the six months. We assume one currency, complete records, and consistent revenue rules. Source A is the January partner-campaign cohort shown in the cohort matrix later in this guide, where its month-six NRR is also 106%.
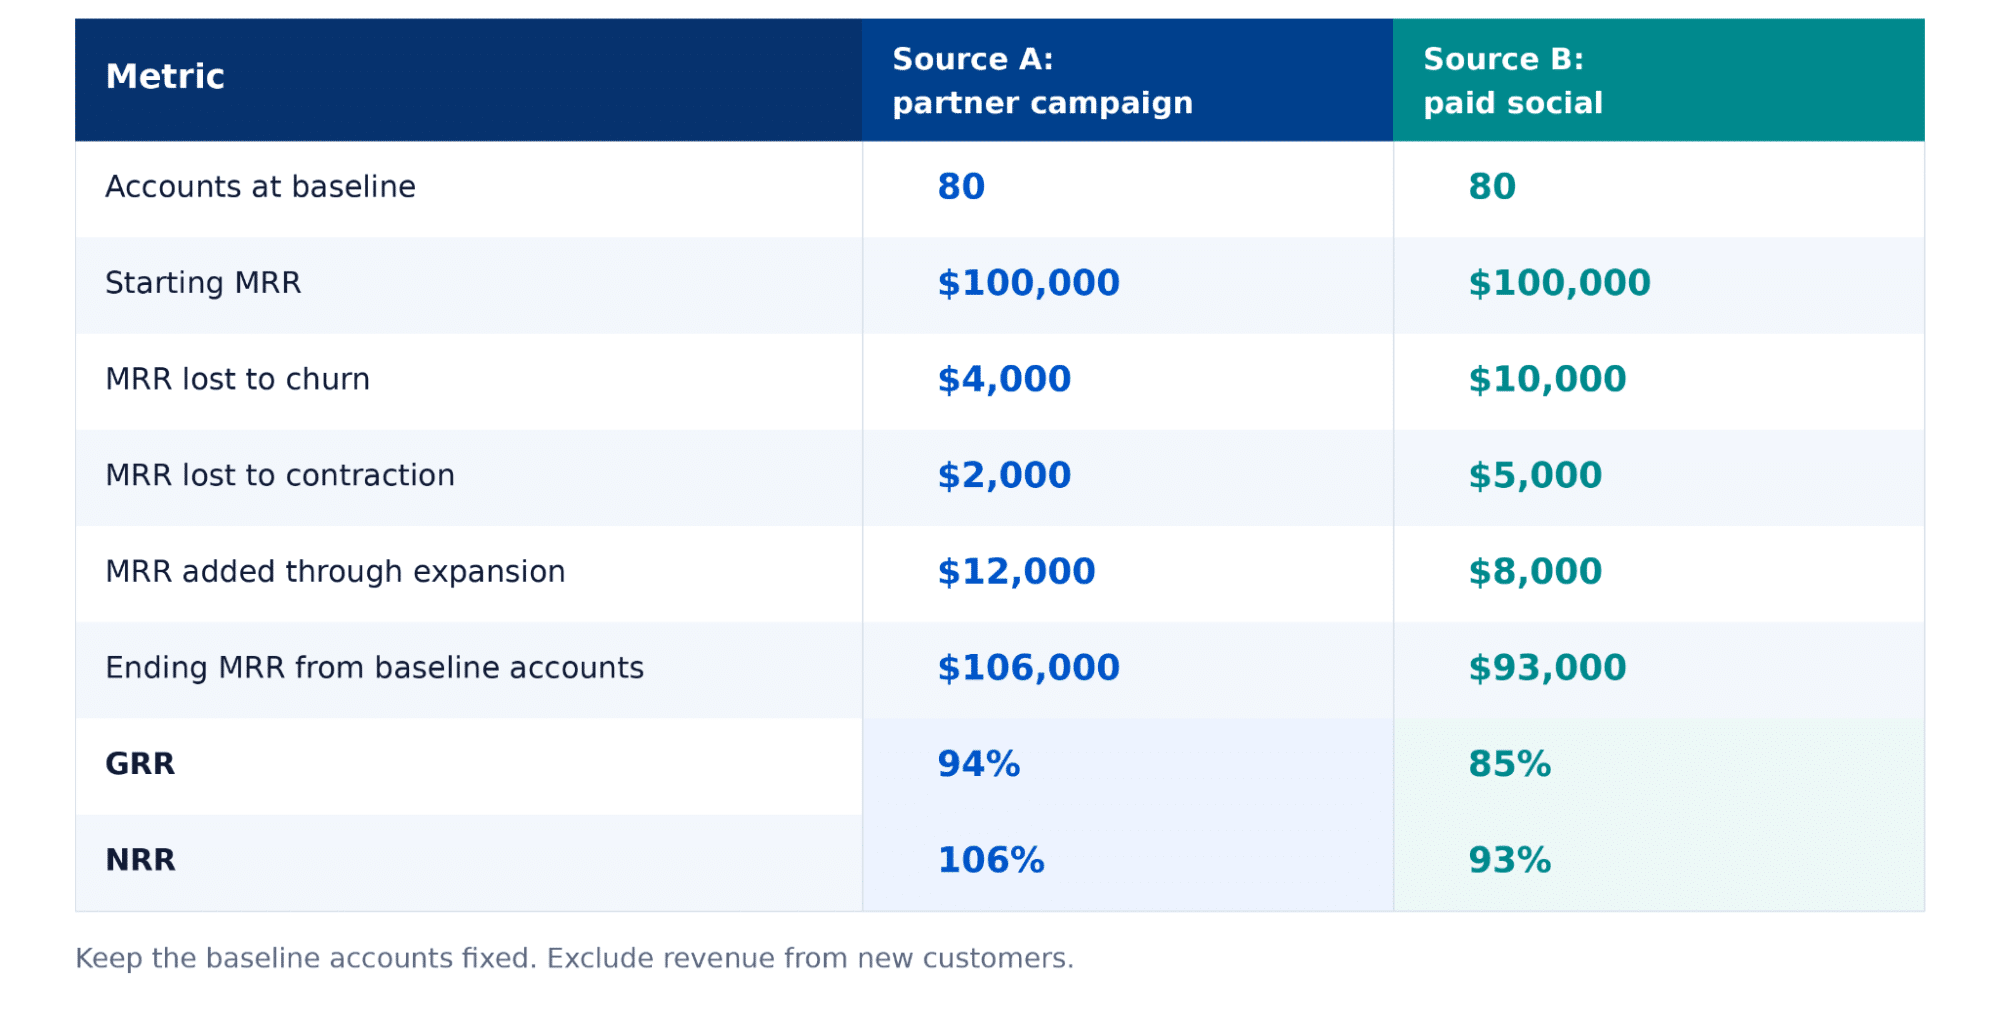
Then, classify each baseline account’s change once:
- Churn: The account’s MRR falls to zero. Count its starting MRR as churn.
- Contraction: The account still pays, but its endpoint MRR falls below its baseline.
- Expansion: The account’s endpoint MRR exceeds its baseline.
This example uses the net change between the two snapshots. Don’t mix those changes with every upgrade or downgrade that happened between them.
For GRR, use:
GRR = (Starting MRR – churn – contraction) / Starting MRR × 100
Source A’s calculation looks like this:
($100,000 – $4,000 – $2,000) / $100,000 × 100 = 94%
Expansion enters the calculation for net revenue retention:
NRR = (Starting MRR – churn – contraction + expansion) / Starting MRR × 100
Adding Source A’s expansion gives us:
($100,000 – $4,000 – $2,000 + $12,000) / $100,000 × 100 = 106%
GRR excludes expansion and cannot exceed 100%. NRR can exceed 100% when expansion outweighs churn and contraction.
Exclude new accounts that join after baseline. Expansion from an existing baseline account counts, including an added subscription. Revenue from a new customer does not.
Source A shows stronger revenue retention, but that does not make it the better investment by itself. Before using the comparison to guide spend, add acquisition costs and a defined contribution measure.
The figures below extend the same hypothetical example.
Acquisition spend includes the sales and marketing costs allocated to each cohort under one documented rule. CAC per paying account divides that spend by the 80 accounts originally acquired, including those that later churn.
Six-month contribution before acquisition costs equals the subscription revenue earned in each account’s first six months, minus the cost of delivering and supporting the service, such as hosting, onboarding, and support. Contribution after acquisition costs then subtracts the cohort’s acquisition spend. Neither measure represents company-wide net profit.
| Metric | Source A: partner campaign | Source B: paid social |
| Acquisition spend allocated to the cohort | $800,000 | $400,000 |
| Paying accounts acquired | 80 | 80 |
| CAC per paying account | $10,000 | $5,000 |
| Subscription revenue over six months | $600,000 | $540,000 |
| Service delivery and support costs | $120,000 | $108,000 |
| Contribution before acquisition costs | $480,000 | $432,000 |
| Contribution after acquisition costs | −$320,000 | $32,000 |
| Month-six NRR | 106% | 93% |
The cumulative revenue and cost figures are additional hypothetical inputs. You cannot calculate them from the starting and ending MRR snapshots alone.
Source A retains and expands more revenue, but its higher acquisition cost leaves it with negative contribution after acquisition costs at month six. Source B has lower NRR but has already covered its allocated acquisition spend. Longer-term results could change that comparison.
Higher NRR does not automatically justify higher spend. Where reliable cost data is missing, show the gap and keep the retention finding separate from any budget recommendation.
Keep activation, support effort, and profitability separate
Revenue retention gives you the outcome. Product and CS metrics help your team understand how those accounts got there.
Activation deserves special attention because it gives teams an early signal. Amplitude’s benchmarks found that 69% of products with strong early activation also showed strong three-month retention.
For B2B technology products, top performers retained 15.6% of users after three months, compared with 2.5% for median performers.
Those findings connect early activation with later product use. They do not measure account-level NRR or prove that activation caused retention. Your team still needs billing data to check how much revenue each cohort keeps.
Keep each supporting metric’s meaning clear:
- 30-day activation rate: The share of accounts that reach your activation milestone by day 30. A higher rate doesn’t prove faster activation.
- Time to activation: The days accounts take to reach that milestone. Report the median or average and show how many accounts have yet to activate.
- Logo retention: The share of baseline accounts that still pay at the endpoint. GRR tracks revenue, so it cannot answer this customer-count question.
- Support workload: Tickets per account show workload volume. Handling hours show the time your team spends over a defined period.
- Labor cost for support: Multiply handling hours by a defined hourly labor cost that includes salary, benefits, and overhead.
- Profitability: Define which revenue and costs your calculation includes. Account for customer acquisition cost (CAC) and service costs over a stated period.
For example, a cohort may show strong NRR but need far more onboarding and support time. That deserves a closer look before your team calls it the better investment.
These measures help explain the retention results. Next, check the account mix before concluding the source.
Validate the result before changing acquisition spend
Cohort analysis can help you make better calls, but pause before shifting budget.
Small sample sizes can trick you. Long contract cycles, one large expansion deal, or one churned enterprise account can also skew the numbers.
So, check what sits behind the result before you rank the sources.
Account mix, maturity, and outliers
“Paid search versus referrals” gives you a rough view, but it can hide important differences.
A paid search campaign for enterprise finance teams can attract very different accounts from one for small SaaS startups. Their budgets, contracts, and support needs may explain part of the retention gap.
Research by SaaS Capital gives useful context. Its 2025 survey of private B2B SaaS companies found:
- Median NRR reached 102% for companies with ACVs between $25,000 and $50,000.
- Top-quartile NRR in that ACV group reached 111%.
- Bottom-quartile NRR stood at 97%.
- Companies with the highest ACVs also showed the strongest GRR.
These are annual company-level benchmarks. They are not targets for our six-month source comparison. They show why contract value deserves a place in your checks.
So, before changing spend, review:
- Sample size: Show account count and starting revenue. A handful of accounts can produce a large percentage swing.
- Customer mix: Compare ICP segments, baseline ACV, plan, and use case.
- Pricing: Check discounts and price changes. A price increase can raise NRR without deeper product adoption.
- Sales motion: Separate self-serve accounts from sales-led deals where possible.
- Contract timing: Check contract length and renewal dates. An account that has not faced renewal tells you less about renewal strength.
- Onboarding treatment: Identify differences in training, implementation, or access to dedicated CS support.
- Cohort maturity: Confirm that every account has reached the endpoint age.
- Outliers: Recalculate the result without the largest expansion or churn event. Show both versions rather than quietly removing the account.
For maturity checks, line up results by time since first payment. A newer cohort may have a month-three result but no month-six result yet. Leave the later cell blank so readers can see the limit.
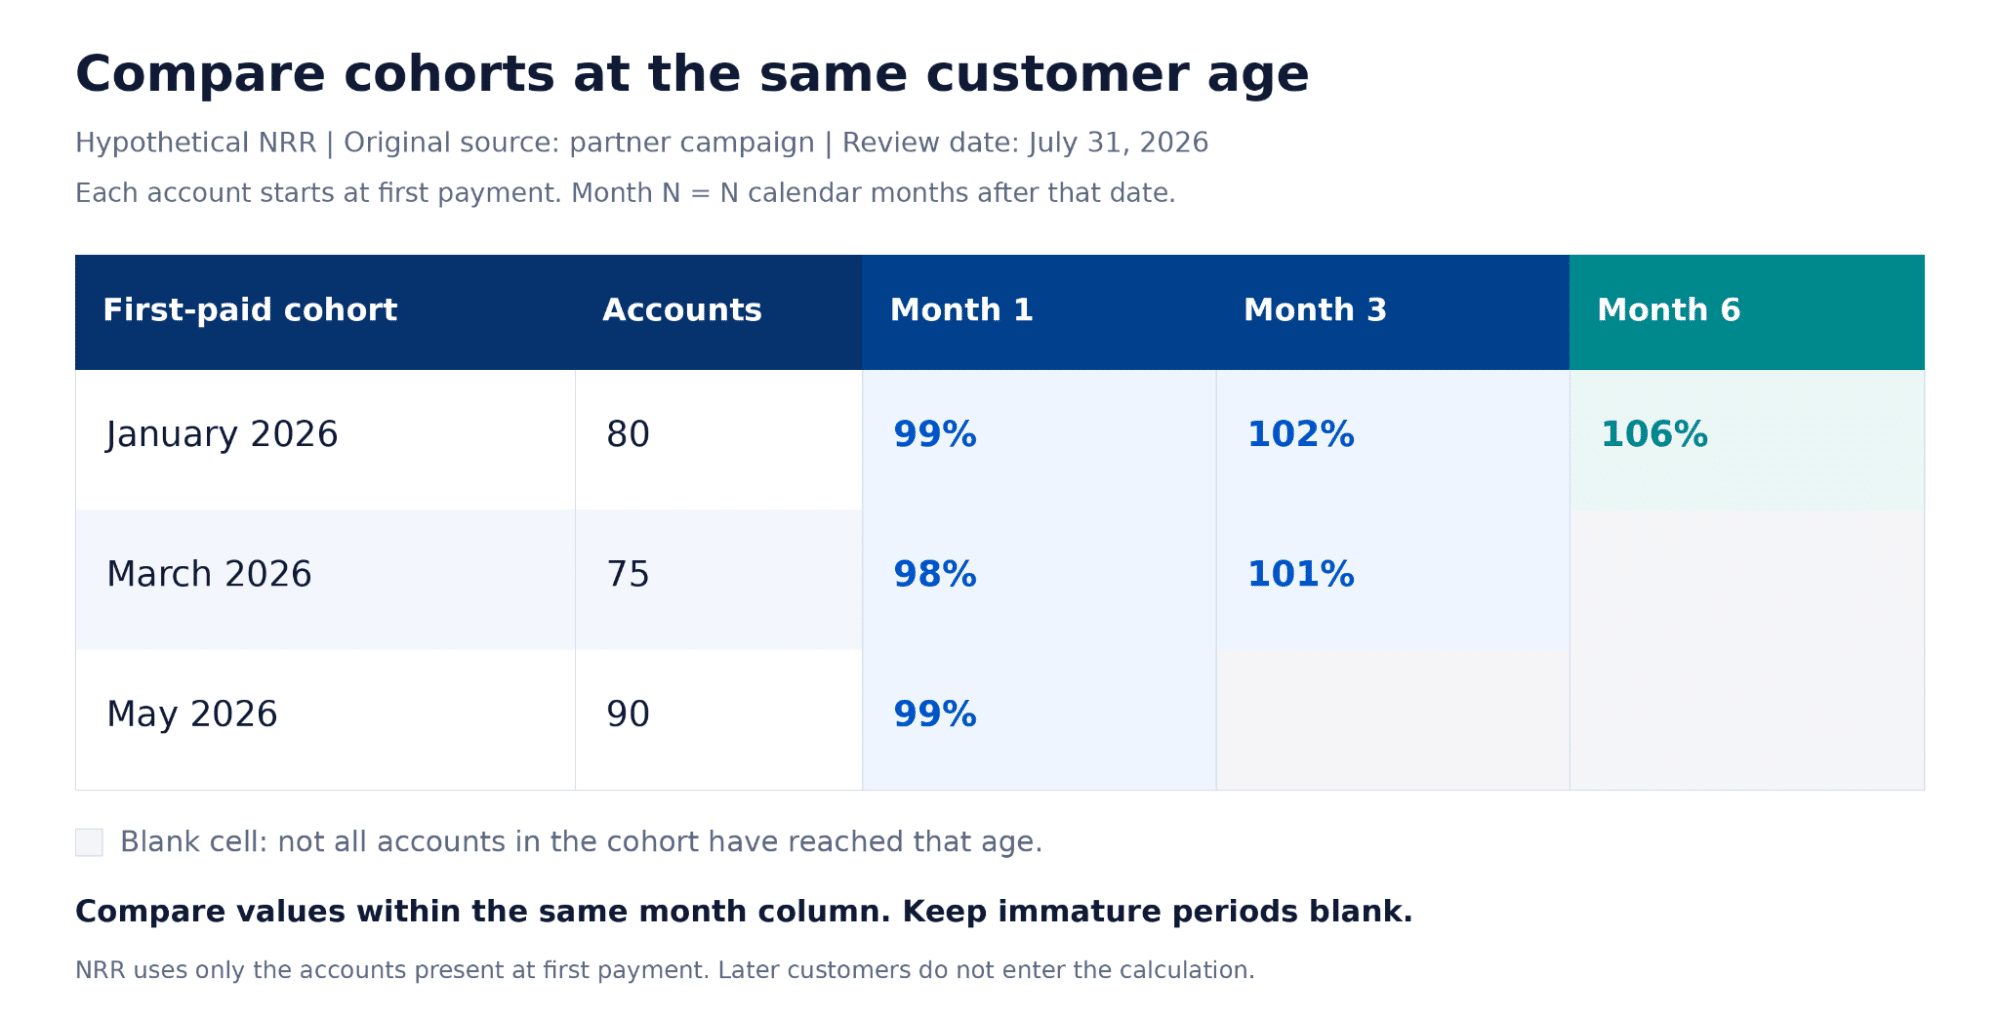
If the source gap shrinks when you compare accounts within the same ACV band or sales motion, account mix may explain part of it. Keep that finding in the review.
Association, confounding, and the next test
A stronger source cohort does not prove that the channel caused stronger retention.
Your report describes the outcomes of accounts under your chosen source rule. It does not show what those same accounts would have done without that channel.
Other factors can shape the result. Partner referrals may bring in larger accounts. A sales team may offer those accounts more onboarding support. Either difference could help explain their NRR.
Use the gap to choose the next question.
Let’s say one campaign shows higher customer churn. CS notes suggest those customers expected a different product experience.
Marketing can compare the campaign’s promise with those notes and churn reasons. Then the team can test a clearer message.
Or suppose referrals show higher NRR. Compare referred and paid-search accounts within the same ICP, ACV band, and sales motion. Check if the difference holds across several mature cohorts.
A repeatable pattern gives you a stronger reason to investigate. For a material budget change, consider a controlled test with a defined audience, success metric, and follow-up window.
You’re looking for evidence your team can act on. The next step may be to test a message, fix onboarding, hold spend, or gather more data.
Run a shared Marketing, RevOps, Finance, and CS review
Attribution should help your team decide what to do next.
Bring the cohort findings into a regular review. Marketing needs the post-sale context, while Finance and CS need to understand which campaigns brought those accounts in.
Expansion can represent a large share of growth. High Alpha’s 2025 report found that SaaS companies above $50 million in ARR generated roughly 60% of their new ARR from existing customers. That benchmark describes larger SaaS businesses. It does not set a target for every company or explain which source caused expansion.
For your review, follow the revenue changes back to the accounts behind them. Which customers expanded? What did they have in common? Could their plan, onboarding, or use case explain the difference?
Assign owners to the inputs and definitions
Each team sees a piece of the journey. Give each one a clear role in checking the report:
- Marketing owns source capture, campaign labels, and the documented source rule.
- RevOps owns account mapping, join quality, and duplicate checks.
- Finance owns recurring-revenue definitions, revenue reconciliation, and GRR/NRR calculations.
- Customer Success adds onboarding, adoption, renewal, and expansion context.
Adjust those roles to your company, but name a person for each responsibility. Also choose one owner to prepare the report and track follow-up actions.
A monthly review can cover data quality and early signals. Review mature retention results as cohorts reach the agreed endpoint. For annual contracts, keep renewal timing visible so the team knows which accounts have faced a renewal decision.
Use the same definitions each time. If your team changes a source rule or activation event, record the change and explain which comparisons it affects.
Record the next decision
A useful review ends with a clear next step.
For each finding, record the result, a plausible alternative explanation, an owner, the next test, and the metric that will confirm or challenge the hypothesis. Set a follow-up date too.
Let’s say one campaign brings in customers who churn because they expected a different product experience. Marketing can tighten the message. CS can help identify the expectation gap from onboarding notes and churn reasons.
The decision record could look like this:
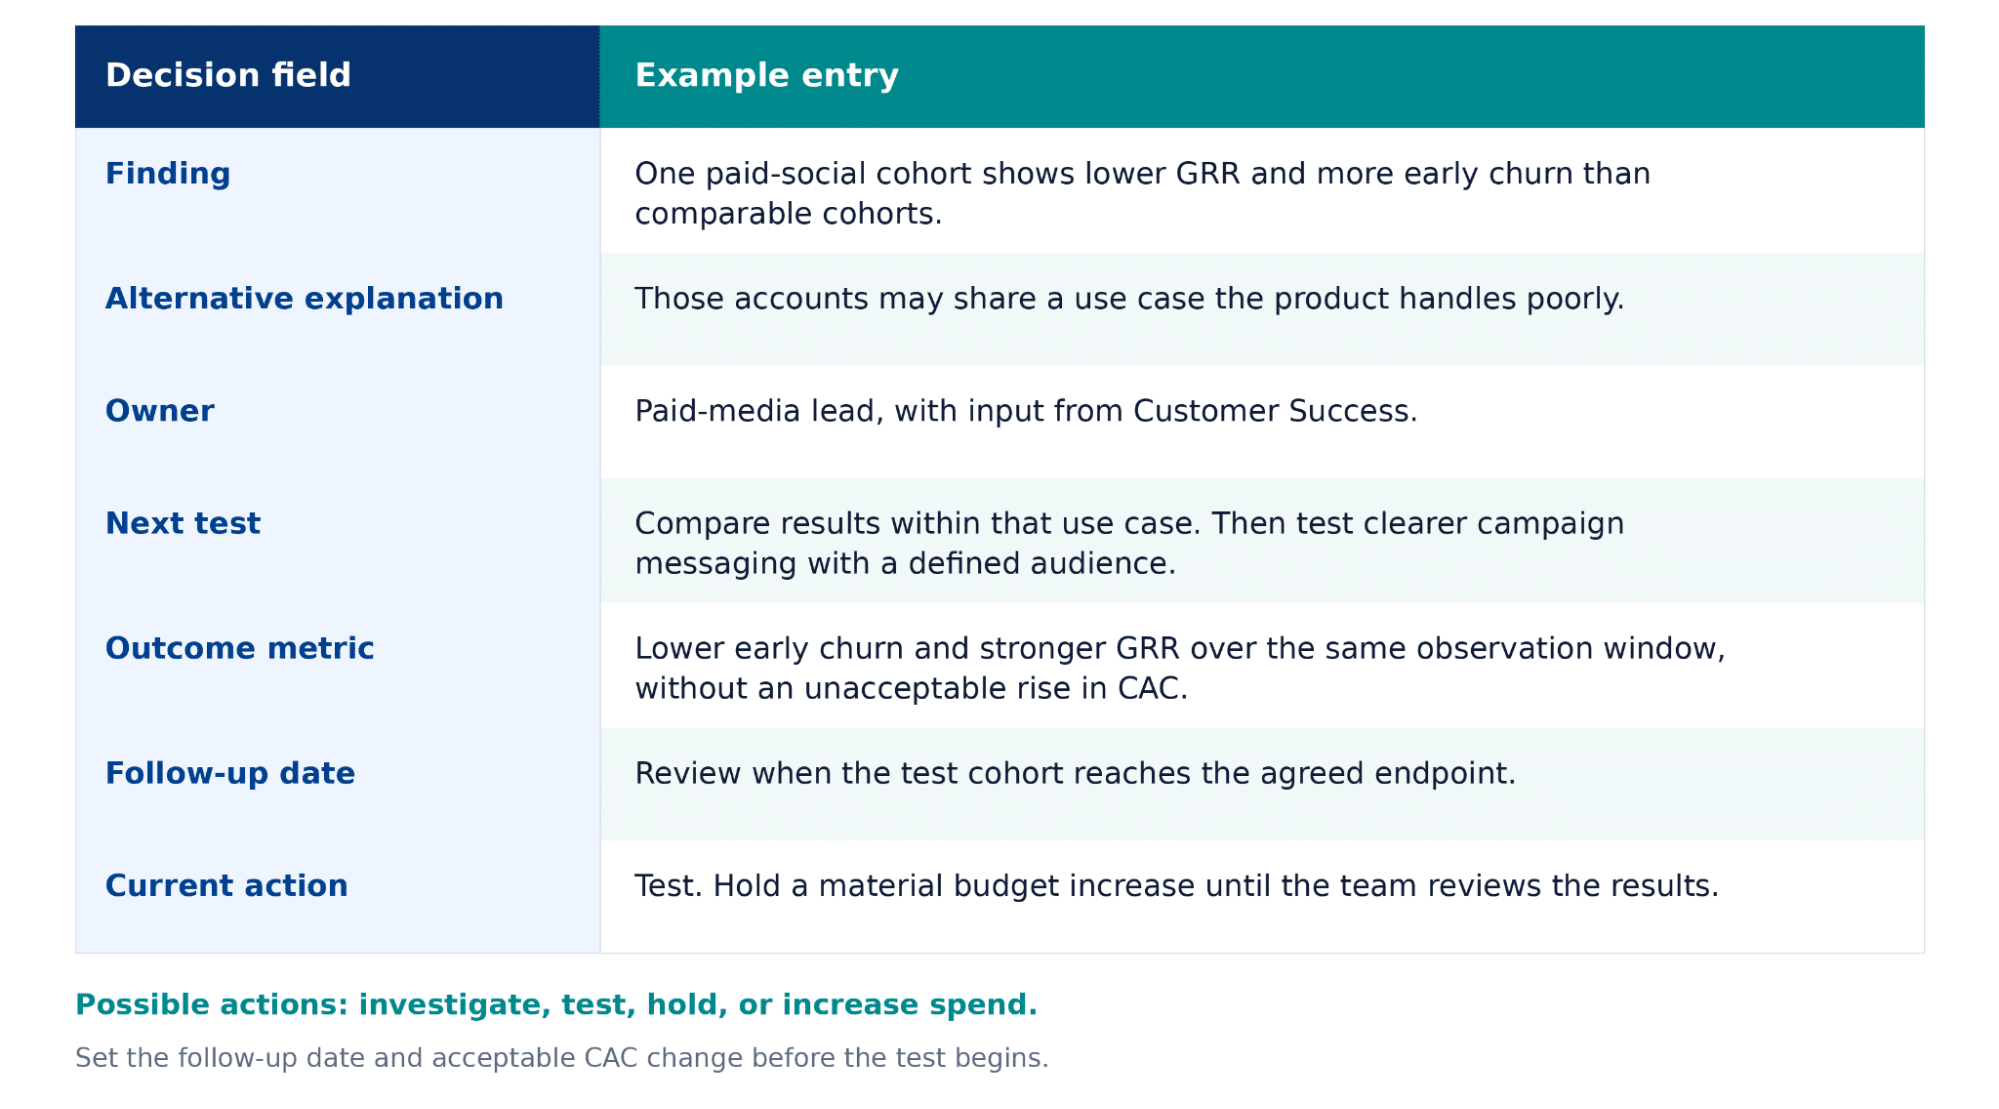
Record the action as investigate, test, hold, or increase spend. A data gap may call for investigation. An immature cohort may justify holding spend. Consider a limited increase only when mature retention results, CAC, and a defined contribution or payback measure support it. Set monitoring rules for the added spend, since the next group of customers may perform differently.
Your team can use customer journey analytics to connect campaign activity with these account outcomes. Keep the definitions, findings, and tests together so the next review can check what changed.
That gives Marketing, RevOps, Finance, and CS a shared record of the decision and the evidence behind it.
Wrap Up
Your first report can stay simple.
Group paying accounts by acquisition source and first-paid period.
Compare them from first payment to the same customer age, and show account count, starting recurring revenue, GRR, NRR, activation, and support effort. Where reliable cost data exists, add acquisition spend, CAC per paying account, and contribution over the same window.
Keep the source rule visible. Check the revenue totals with Finance, and ask CS what could explain the differences. Those checks help your team choose a next step, assign an owner, and agree on the metric to review.
If gaps between systems make that work harder, partners like Fieldtrip can help connect acquisition activity with retention and expansion. The goal stays the same: give your team a report it can check and use to plan the next test.
You don’t need to settle every budget question in the first review. Agree on what to investigate, then bring the results into the next conversation.