Unravelling client data is a recurring nightmare for CSMs. Now, with our advanced Calculated Metrics, effortlessly merge datapoints to align with your goals and analyze trends with precision. Transform complex customer success metrics into clear, actionable insights.
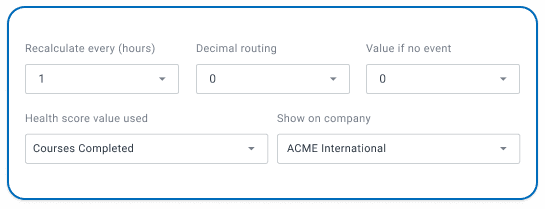
A metric by itself is just a number, not a KPI or an insight. Our dynamic and advanced calculated
metrics are values built on the data you send (API, integrations, or manual entry). With Custify, users
can transform these values into meaningful insights and effectively utilize them in segments,
dashboards, or health scores.
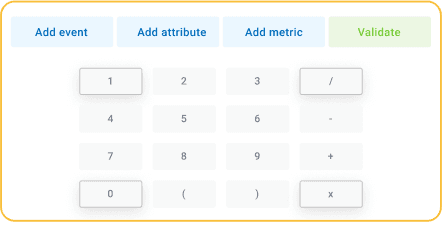
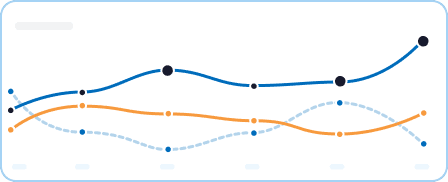
Automated, Dynamic Calculated Metrics
Create trends and identify usage patterns
Compare past and present customer success KPIs to identify changes in user behavior. Look at relative
changes, rather than absolute values.
This helps you understand the evolution of product usage over time directly in your
customer success software
, which could be integral in spotting potential issues or opportunities.
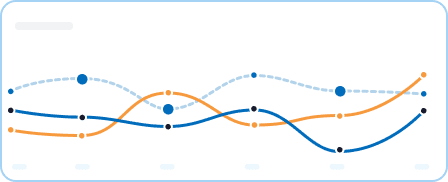
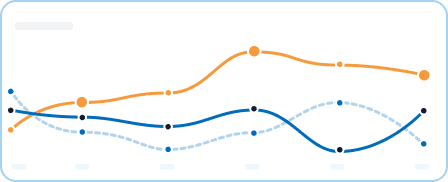
Advanced, Customizable Calculated Metrics
Build benchmarks and normalize customer success KPIs
Looking to compare segments and accounts over time? Benchmarks are a simple mechanism for normalizing data
in order to achieve this.
Basically, these allow you to create a standardized reference point for key metrics for customer success.
This facilitates a fair comparison, allowing for more accurate insights, like comparing logins between
large and small accounts.
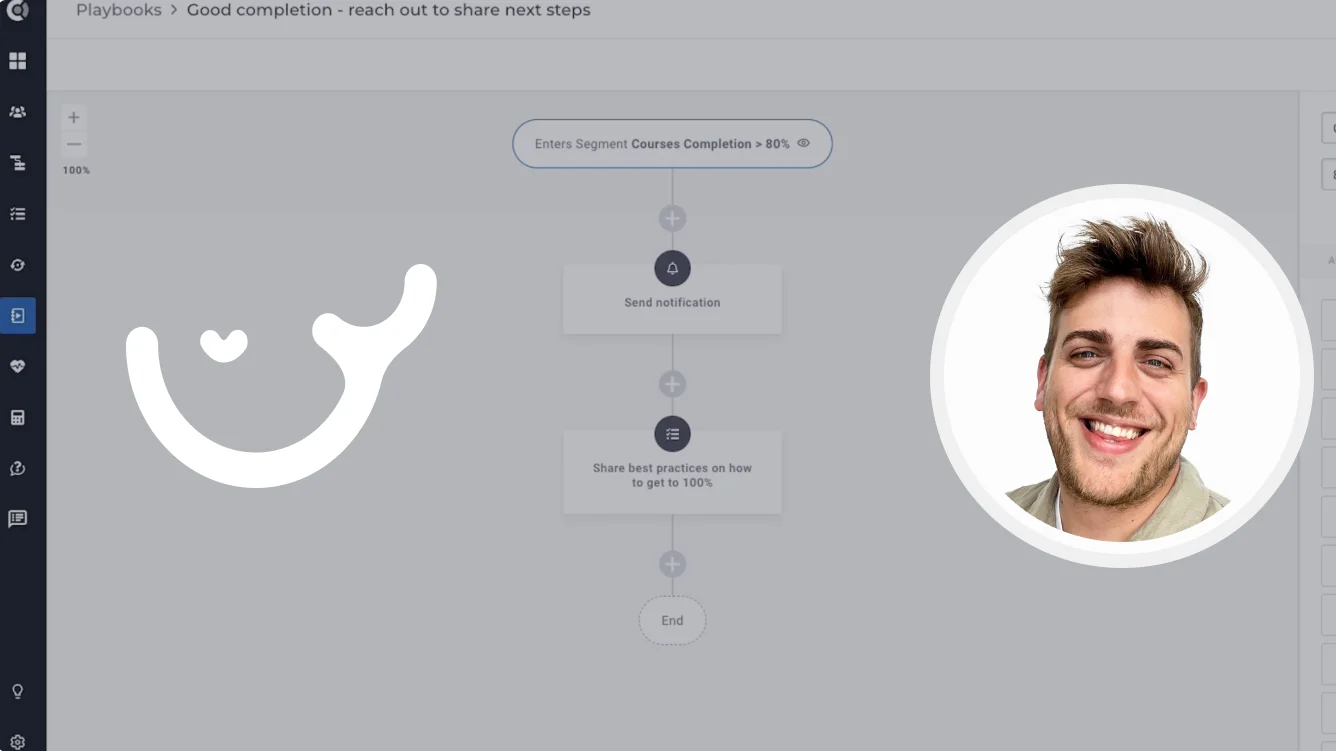
How do our clients use Customer Success 360 & Custify?
"
Before Custify, I would lose an entire day sending the same email over and over again, checking
metrics, and scheduling meetings. Now, my inbox is empty at the end of the day because Custify
does everything for me.
Stijn Smet Team Lead Customer Success
"
Before Custify we used spreadsheets to handle any client management workflows and we were spending
far too much time doing manual tasks that could have been automated. Since using Custify, our team
can handle 3X more clients with more care and attention to each of them, through the removal of
all of the tasks and communication lines that they needed.
Daniel Snider - Automation Lead & SM Strategist
"
One of the things that we liked too, was that the product was young. Some of the other platforms
that we saw were clunky. They had every feature under the sun that we were asking for. But it also
meant that there was no flexibility in how things would be able to get built out or in any of our
requests
Ailyn Mendoza Director of Customer Success & Support
Irina Vatafu - Head of CS at Custify
Irina Vatafu - Head of CS at Custify
Are you ready to become a data-driven CSM?
Let Custify guide your SaaS customer success journey with clear, actionable reports and insights.
Notice: This website or its third-party tools use cookies, which are necessary to its functioning
and required to achieve the purposes illustrated in the privacy policy. If you want
to know more or withdraw your consent to all or some of the cookies, please refer to the
privacy policy
. By closing this banner, scrolling this page, clicking a link or continuing to browse otherwise, you agree
to the use of cookies.