As a Customer Success professional, your world revolves around engagement scores, customer health, and adoption metrics.
Yet across the hallway, the Chief Financial Officer (CFO) and the finance team are speaking a language that often sounds foreign. Talk about margins, forecasts, and predictable revenue.
Most of these words connect directly to the finance department’s balance sheet, but rarely with your CS dashboard. The result? A silent gap. Customer Success claims it drives growth, but finance can’t trace the impact.
If there’s no traceable impact, CFOs can’t allocate proper resources to your team for growth. So, CS starts to underperform, and your organization’s scaling tanks as collateral damage.
To close the gap, you need to view Customer Success through a quantifiable lens and speak the language your CFO understands. This article shows you how.
Customer Success in financial terms
Customer success teams portray progress as customer retention, increased acquisition, a base of advocates, and rapid product adoption.
However, these terms are primarily qualitative and do not explain how CS activities tie to your organization’s financial health.
Here’s how CFOs want you to show it instead;
1. Retention as GRR/NRR
Customer retention is your CS team’s ability to keep existing customers on board through repeat purchases and expansion tactics such as upgrades or cross-sell. According to KPMG, bumping your retention by just 5% can lead to a double-digit increase in revenue.
For CFOs, customer retention numbers should be translated into GRR and NRR.
Gross Revenue Retention (GRR)
This is the percentage of recurring revenue from existing customers, excluding expansion inflows from upgrades and cross-sells.
Formula
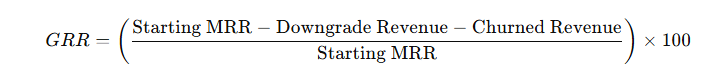
Breaking down the terms
- Starting MRR: Total recurring revenue from existing customers at the start of the period
- Downgrade Revenue: Revenue lost when customers switch to lower plans or reduce usage
- Churned Revenue: Revenue lost when customers cancel their subscriptions entirely
So, let’s say your starting MRR is $100,000. During the month, customers churned $ 5,000 in revenue and downgraded plans for $5,000, resulting in $10,000 in lost revenue.
Using the formula, your GRR will be 85%. For a CFO, this data can help evaluate the company’s revenue stability and the performance of the customer success team.
Higher GRR indicates strong retention and boosts cash inflow. The reverse is the case for low GRR.
Net Revenue Retention (NRR)
Unlike GRR, net revenue retention includes recurring revenue from existing customers, expansion inflows from upgrades, and cross-sell revenue.
Formula

Breaking it down
- Starting MRR: Recurring revenue from existing customers at the start of the period
- Churned Revenue: Lost revenue from customers who cancel
- Downgrade Revenue: Lost revenue from plan reductions
- Expansion Revenue: Gained revenue from upgrades, add-ons, or cross-sells
Now imagine your starting MRR is $100,000. During the month, customers churned revenue worth $8,000, downgraded plans worth $2,000, and expanded their subscriptions by $15,000.
Using the formula, your NRR will be 105%. It means your existing customers not only replaced the $10,000 in lost revenue from churn and downgrades but also generated an additional 5% growth through increased spending or expansion.
2. Expansion as part of NRR
Expansion means additional revenue generated from existing customers through upgrades, add-ons, cross-sells, or any other tactics that get them to spend more.
According to a PwC report, a good customer experience is one of those tactics, as 43% of customers are willing to pay for better delivery.
Importantly, expansion is calculated as part of the net revenue retention and used to determine:
- The growth and,
- Health of your customer base without acquiring new customers
For example, if churn and downgrade losses total $10,000, but expansion adds $15,000, your NRR increases to 105%.
If NRR is less than 100%, then it means your existing customers are spending less, and the churn/downgrade losses exceed expansion gains.
For a CFO, that’s revenue contraction, a clear sign that retention or product value needs more attention.
3. Advocacy
Stanislav Khilobochenko, VP of Customer Services at Clario, says,
“Advocacy is voluntary referral by customers who trust or are loyal to your brand. Often, the only cost you need to account for is the one for setting up your advocacy program, if any. Otherwise, you’re basically spending nothing.”
Quantitatively, advocacy ties to Customer Acquisition Cost (CAC). The more customers you gain through advocacy, the lower your CAC, and the higher your gross margin.
When referrals account for a growing share of new revenue, your LTV:CAC ratio improves and marketing efficiency rises without extra budget.
For a CFO, what matters most is CAC efficiency.

- New ARR from referrals (recurring revenue): Recurring revenue from advocacy programs
- Total acquisition/referral spend: The amount spent on referral acquisitions/advocacy programs (including marketing and referral rewards)
So, let’s say your New ARR from advocacy is $120,000, and your Total Spend is $20,000.

That means your company generated $6 in new recurring revenue for every $1 spent.
4. Activation & Adoption
Activation and adoption measure how quickly and effectively customers start using and gaining value from your product after purchase. Good customer service and support enable this.
- Activation: When a new customer completes the first key action that shows product use, for example, setting up an account or first transaction
- Adoption: When customers use the product consistently and derive measurable value from it
What’s most crucial is that both drive faster revenue realization. The sooner your customers use a product, the sooner you can recover the cost of acquiring them. That’s payback.
The payback period helps you figure out how long it’ll take to recover CAC, in days, weeks, or months.

If your CAC is $1,200 and each customer generates $400 in gross margin per month, your Payback Period will be 3 months.
CFO Chart: Customer Success Activities and Financial Impact
| CS Activity | Financial Metric | Business Impact |
| Retention | Gross Revenue Retention (GRR) and Net Revenue Retention (NRR) | Measures how much recurring revenue you keep from existing customers, showing long-term stability and customer satisfaction. |
| Expansion | Net Revenue Retention (NRR) | Reveals revenue growth from upgrades or cross-sells, indicating customer value increase and product adoption strength. |
| Advocacy | CAC Efficiency (Referrals vs Paid Acquisition) | Tracks how referrals and word-of-mouth reduce acquisition costs, improving marketing ROI and growth sustainability. |
| Activation & Adoption | Payback Period | Shows how quickly customer success drives value realization, leading to faster profitability and better cash flow. |
The Cost-Savings and Risk-Reduction angle
Customer Success plays a key role in revenue protection by identifying and recovering potential revenue losses before they impact the books. Here’s how your CFO expects to see it.
Quantify ARR at risk each month (sum of red accounts)
Red accounts are customers who are at risk of churning. Your CS team can easily identify them early on, before they ditch, by identifying factors like:
- Slow responsiveness
- Late or irregular renewals
- Lower engagement with the product
- Frequent complaints
“What your CFO needs is the ARR at risk”, Simeon Genadiev, Managing Partner at The G Law Group, says.
“Once CS team provides figures on customers showing churn signals, the finance team can see the revenue tied to each person, calculate the total ARR at risk, and sound the alarm for a quick fix”, Simeon continues.
Report: We currently have $X ARR at risk.
Track recovery rate and save rate
Identifying who’s churning is just half the job of CS teams. They move quickly to recovery once risk signals show up. This can involve:
- Re-engagement campaigns through emails or calls
- Adding incentives or discounts as applicable
- Proactive support in case of difficulty using a product or tech issues
Grant Aldrich, Founder of Preppy, estimates, “If CS recovers 20 of 25 at-risk or red accounts, the recovery rate is 80%. For the save rate, that’s the value of ARR retained (which could have been lost if CS had failed to recover those 20 customers).”
“These numbers give you a precise measure of revenue protection and the financial value of timely intervention”, Grant concludes.
Report: Our recovery rate last month was Y%.
Lower churn to increase LTV and CAC/LTV ratio
Good customer service and a positive support experience reinforce retention. More retention means lower churn. Lower churn means your customers stay longer, spend more, and might even become advocates.
From a CFO’s lens, all these translate into:
- Increased customer lifetime value (CLTV)
- Reduced CAC/LTV ratio since you’re retaining longer and extracting more value
Financially, you can measure the impact by the percentage increase in LTV and the drop in CAC for each increase in retention rate or decrease in churn rate.
Report: Reducing churn by 2% in the past quarter increased LTV by ~20.5%.
Address involuntary churn (dunning, retries, billing updates)
Involuntary churns are often due to failed payments or expired cards. CS teams follow up on these failures for quick recovery through dunning and specialized support.

So, financially, what you should present is the recovered ARR.
Report: Automated dunning and billing updates recovered $X ARR this quarter.
Compliance, audit trails, permissioning, data retention
Customer Success also helps protect financial integrity.
For instance:
- Substantial compliance and data controls keep account and billing records accurate and verifiable
- Audit trails make every customer change traceable
- Permissioning limits who can access or edit billing data
- Clear data retention ensures accurate records for audits and reporting
The result is fewer chargebacks and cleaner revenue recognition, which in turn gives CFOs reliable numbers and lower compliance risk.
Proving the ROI of Customer Success investments
To justify your organization’s customer success investments to your finance team, you need to connect your team’s activity to measurable financial outcomes. This requires using the four-point framework: Baseline, Interventions, Assumptions, and Output.
Here’s how:
-
Baseline
Anna Zhang, Head of Marketing at U7BUY, says, “The baseline is where you started and provides a snapshot of your company’s financial health right before implementation. This will give a proper backdrop for measuring the impact of your CS activities.”
Start with tracking GRR, NRR, gross profit margin, and support cost per account over the next 6–12 months.
-
Interventions
Interventions are the actions you plan to take or have taken.
Once you have a snapshot of how things have been before, turn the wheel by implementing funded CS activities such as personalized onboarding, advanced automation, health score monitoring, voluntary churn recovery campaigns, dunning, and other practical measures.
-
Assumptions
Assumptions are variables you can’t control.
“For instance, imagine your current churn rate is 5% and your goal is to bring it down to 1% within the next three quarters. There’s a possibility for deviation. It could be as little as -0.2pp from the expected churn drop. So, you might end up having 1.5% churn left instead of 1% in the end”, Jeffrey Zhou, CEO and Founder of Fig Loans, shares.
Jeffrey advises “accounting for these deviations ahead of time by assuming a 0.5-point drop in churn or a 1-point increase in expansion.”
-
Output
After implementation, track effectiveness and turn it into quantitative results such as ARR savings, ARR expansion, and/or total uplift compared to previous financial records or the snapshot you took earlier.
Let’s say your company has $2M in ARR and a 5% monthly churn rate.
After CS implements proactive onboarding and automated health tracking in conjunction with the finance team, churn falls to 4.5%, and expansion revenue rises by 1%.
Here’s how your report summary will/should be:
- ARR saved: $2M × 0.5% = $10,000 saved monthly
- ARR expansion: $2M × 1% = $20,000 gained monthly
- Total uplift: $30,000 additional ARR per month
How to build a CFO-Friendly CS Dashboard
The typical CS dashboard contains engagement metrics such as health scores, product usage, ticket volume, and customer sentiment.
While these are useful for internal monitoring, they often fail to communicate financial value, especially when you’re working in tandem with the finance team.
This is how to build a CFO-friendly one instead:
Show key financial metrics
Since it’s CS, keep your typical engagement metrics onboard. But introduce key customer success metrics that speak to finance, like GRR, NRR, CAC efficiency, Expansion Revenue, and Support Costs in a clear top-line summary panel. Then, connect each one to your CS functions, including retention, expansion, advocacy, and payback, to make the link between activities and outcomes clear.
Use visuals that tie to revenue outcomes
Include charts that show how CS actions influence revenue over time. For instance, an NRR bridge can display how expansions and churn affect total revenue, while forecast trend and revenue movement charts can help visualize growth stability and predictability.
Exclude vanity metrics without financial value
Metrics like login counts, email opens, ticket volume, and social interactions may look impressive, but rarely translate to revenue or savings. Focus instead on indicators that show real financial outcomes, such as renewal rate and expansion revenue.
Keep data-driven and easy to connect to ARR and profitability
Pull as much data from your sources, from CRMs to your organization’s bookkeeping software. Your CS dashboard should contain only data-backed, quantifiable results. Most importantly, they should connect to your recurring revenue, whether it’s an upslope or a down trend. This helps CFOs determine profitability and issues present at a glance.
Using Financial Data to Answer CFO Objections
CFOs are primarily concerned with ensuring that every drop of investment yields financial growth for the entire organization. Given the highly qualitative nature of customer success ops, there’s bound to be friction and objections.
Let’s see some of these objections and how to handle them.
CS is soft
When a CFO says “Customer Success is soft,” they mean CS focuses on intangibles like relationships, customer happiness, and engagement. Things that don’t clearly show up in financial statements.
In other words, they see CS as non-quantifiable or not tied to revenue or profit.
To successfully counter the objection, provide quantitative figures that directly link referrals, renewals, expansion, and churn to revenue impact.
Tool sprawl
Tool sprawl means using too many separate software tools across teams, often with overlapping features. Practically, it keeps the CS team in a silo, and financially, it can be budgetarily inefficient. That’s why most CFOs query the tools you use.
Even if a CS platform is in place, a CFO might ask whether it delivers enough value compared to simpler or cheaper options.
To address this, present a financial comparison showing that a unified CS platform reduces total costs, improves automation, and scales better than multiple disconnected tools.
Headcount creep
When CFOs question the growing team size, present CSM-to-ARR ratios segmented by customer tier and show how each added person helps efficiently manage CS and contributes to the overall financial security of the company.
Also, present how automation reduces manual work and enables the team to handle more accounts efficiently without proportional increases in headcount.
Focus on new logos
CFOs might sometimes question why you need so much budget for investing in existing customers when the same funds could have been used to acquire new customers. To counter, model how a +2pp NRR gain equals the same ARR as multiple new logo wins.
For instance, Company A has an existing ARR of $25,000,000. Suppose the company acquires five new customers:
A new customer brings $100,000 ARR
5 customers are $500,000 ARR
On one hand, if there is a +2pp expansion revenue growth from the existing customer base:
+2pp equals 2%
ARR gain = 25,000,000×0.02 = 500,000
That means even minor improvements in NRR can match multiple new sales efforts. Thus, focusing on customer success, upselling, or reducing churn can be more efficient than hunting for new logos.
Conclusion
CS is core to every organization’s financial health. That’s why you need to translate your activities and achievements into monetary terms so CFOs can clearly understand their impact on revenue, retention, and growth.
Present your advocacy impact through CAC efficiency, retention via GRR and NRR, and adoption in the payback period. Tailor your dashboard to be CFO-friendly, and create a framework to prove the ROI of investments in your CS initiatives.
Lastly, appropriately counter each objection with data-driven links to financial growth.