Customer success metrics help teams make sense of disparate customer signals and create purpose-led customer success dashboards to track business outcomes and goals such as revenue, retention, costs, growth, and churn signals. Today, customer success metrics are moving more towards sentiment analytics and experience-based metrics, highlighting customer value realization and goal achievement.
In this article, I’ll take an in-depth look at the most important customer success metrics, blending the classic, core metrics (churn, retention, adoption) with newer, trending, and more complex metrics (sentiment, active engagement, effort). The result? A future-proof list of outcome-defining metrics for your SaaS needs.
What to expect: the metrics will be divided into categories based on what type of information they pertain to (retention, outcomes, costs, and more). Each metric will be labeled based on its importance and complexity, and I’ll be adding formulas and calculators to help with the math. Lastly, some CS leaders will be sharing their opinions throughout the piece, so be on the lookout for expert-led insights.
I like data and metrics because they remove biases, but the formulas for measurements can be biased, which cause misleading information.
– Chris Otenbaker, Director of Client Success PlanITROI

1. Churn Rate
Core Metric
A company’s churn rate indicates the percentage of customers or revenue they’ve lost over a set period of time. As such, the term “churn” can refer to either customer churn or revenue churn, and while most SaaS discussions mention churn to refer to the former, revenue churn still plays a vital role as a customer success metric.
Churn rates can also be divided into gross and net churn rates. For customer churn, gross churn indicates the total number of cancellations, while net churn only refers to voluntary cancellations.
Churn is one of the few metrics that tells you both what already went wrong and what your business failed to catch in time. A rising churn rate rarely points to a single issue. It usually reflects a mix of poor-fit acquisition, weak onboarding, low product adoption, and unclear value. That is what makes churn so useful, it forces you to look past the lost account and examine the system that produced the loss.
– Vicky Kalbande, General Manager, Sleek Bill
On the other hand, gross revenue churn indicates all lost revenue, while net revenue churn factors in expansion revenue over the same period, which is a more realistic way of looking at revenue gains/losses.
How to Calculate Churn Rate
To calculate Customer Churn Rate, you simply divide the total number of cancellations (churned customers) over a given period (usually one month) and divide that number by the total customers gained during that same period. The result is multiplied by 100 to obtain the percentage value for your churn rate.

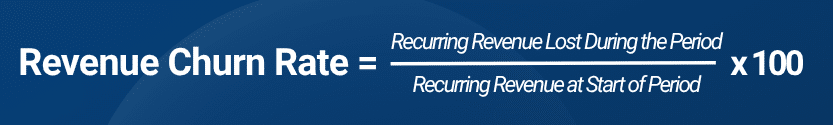
To calculate Revenue Churn Rate, divide the recurring revenue you lost during a given period (usually one month) by the recurring revenue you had at the beginning of that same period. Lastly, to obtain the rate value, multiply the result by 100.
To help you out with calculating your churn rate, we put together the following:
- Customer Churn and Growth Rate Calculator. Part of our Customer Growth Rate calculator spreadsheet. Simply copy this document to your Google Drive and replace the values with your own. This should give you your current customer churn rate as well as your growth rate.
- SaaS Churn Calculator. Here you can enter your current churn and see a projection of customers lost over the next 12 months.
2. Retention Rate
Core Metric
A business’s customer retention rate represents the total number of customers it has managed to keep over a given timeframe. Retention rate is the opposite of the customer churn rate and presents a different perspective. Think of it like this: where churn rate indicates the glass-half-empty part of your customer base, retention rate looks at the glass-half-full part.
How to Calculate Retention Rate
To calculate your Customer Retention Rate, subtract the number of customers gained for a given period (one month is the usual) from the number of customers you have at the end of that period. Then, divide the result by the customers you had at the beginning of that period, and multiply the result by 100.

3. Revenue Retention
Core Metric
Revenue retention metrics indicate how much recurring income a business is able to keep on a monthly basis. Revenue retention is thus one of the most important and common metrics by which subscription businesses measure their success and the effectiveness of their customer success teams.
Revenue retention is usually split into Gross and Net values, the latter also factoring in expansion MRR. See both formulas below.
Why GRR/NRR? Because that’s how boards and exec staff talk.
– Jeff Kushmerek, CEO and Founder, Infinite Renewals
How to Calculate Gross / Net Revenue Retention
To calculate your Gross Revenue Retention (GRR) rate, subtract your Churned MRR from your Starting MRR, then divide the result by your Starting MRR. Lastly, multiply the result by 100 to obtain a percentage value.

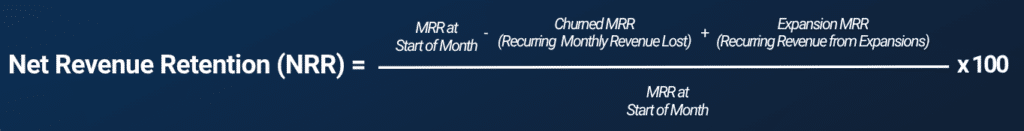
To calculate your Net Revenue Retention (NRR) rate, subtract your Churned MRR from your Starting MRR, then add any Expansion MRR. Divide the result by your Starting MRR and multiply by 100 to get the percentage.
While on revenue retention, let’s also look at Gross Profit:
GPR (Gross Profit Ratio), it factors both Revenue and COGS. It tells you if the revenue you are retaining is profitable. It should be used in parallel to GRR because GRR can lie to you.
You might think Retention is fine, but meanwhile, you are keeping low-margin customers while losing your most profitable ones.
– David Farrell, Manager of Account Management, Maxio
To calculate your Gross Profit Ratio (GPR), simply subtract your Lost Gross Profit from your Starting Gross Profit. Then, divide the result by your Starting Gross Profit and multiply by 100.


4. Recurring Revenue
Core Metric
Recurring revenue is another of the core metrics that define customer success. It showcases the precise recurring revenue for a given period (either monthly, MRR, or annually, ARR, is the norm). As with other customer success metrics, we will also be looking at the net values, which factor in expansion revenue and churned revenue.
How to Calculate Annual / Monthly Recurring Revenue
To calculate your Monthly Recurring Revenue, or MRR, multiply your average monthly revenue per account by the total number of active accounts.

To calculate your Net MRR, add in your Expansion MRR (revenue gained from upsells, cross-sells, and other expansions over the latest period) and subtract your Churned MRR, or the monthly revenue lost over the latest period. The resulting number is a more rigorous estimate of your monthly revenue.

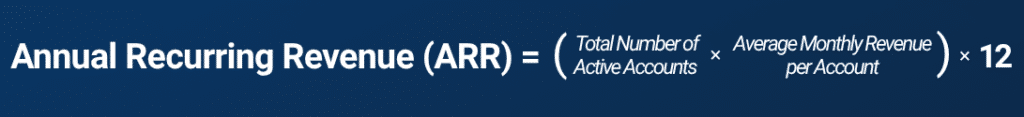
To calculate Annual Recurring Revenue, simply multiply your MRR by 12. So the full formula implies multiplying the average monthly revenue per account by the total number of active accounts, then again multiplying by 12.
To calculate your Net ARR, add in your Expansion ARR and subtract your Churned ARR for the last year.

5. Product Adoption
Core Metric
Product adoption rate is a core customer success metric showing how quickly new users adopt and use a product. While great for indicating the effectiveness of the onboarding process, the real test is the Activation Rate, which works based on custom milestones that indicate a user is successful in using the product.
While the standard formulas below can be very useful for reporting, we recommend building custom, advanced metrics that include more product usage signals:
I picked an adoption rate metric that was actually including more product usage metrics combined together into a rate, a combination that I did based on the needs that we had by that time. And those metrics actually helped me understand how are our customers using the product and what were the categories of customers that we should focus on because we had customers that were having a great adoption rate.
– Irina Vatafu, Head of Customer Success, Custify
How to Calculate Product Adoption Rate and Activation Rate
To calculate your Product Adoption Rate, divide the number of new, active users by the total signups for the same period. Multiply the number by 100 to obtain the percentage value.

To obtain your Activation Rate, set a milestone for activation (such as customers using a specific feature, achieving daily usage metrics, or others). Then divide the total number of users reaching activation by the total signups for the same period. To get the percentage, multiply by 100.

6. Customer Value
Advanced Metric
There are multiple ways to gauge customer value, some more advanced than others:
Customer Lifetime Value, often abbreviated as CLV or LTV, is an indicator of an account’s total average value for a business throughout the lifetime of that contract. It’s calculated by multiplying the average revenue by the average length of a relationship.
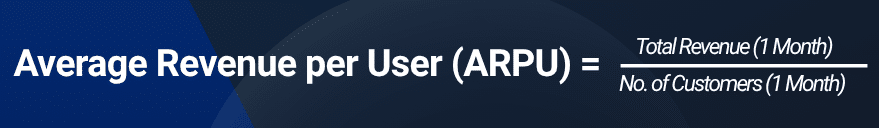
Average Revenue per User (ARPU), also known as the Average Revenue per Account (ARPA), is a metric showing the average dollar amount a user generates for a business in any given month.
Annual Contract Value is also a core metric that showcases customer value, but this time as the average contracted amount per year.
How to Calculate Customer Lifetime Value, ARPU, and ACV
To calculate your Customer Lifetime Value, multiply the average revenue per user (ARPU) by the average length of your customer relationships (measured in months).

To help you calculate your CLV, we built a custom Customer Lifetime Value calculator spreadsheet here.
To calculate your Average Revenue per User (ARPU), divide your total revenue for one month by the total number of customers for that same month.
To calculate your Annual Contract Value for a customer, divide the total contract value by the number of contract years.


7. Net Promoter Score (NPS)
Supporting Metric
Another classic metric for measuring customer satisfaction is NPS. NPS surveys ask users how likely they are to recommend the company or its products to a friend or colleague. While the results (measured on a scale from 1 to 10) can be subjective, the accuracy of the average NPS increases with the number of responses. Survey respondents are split into Promoters (those rating 9-10), Passives (7-8), and Detractors (0-6).
How to Calculate NPS
To measure NPS, simply conduct an NPS survey. Then, subtract the percentage of Detractors from the percentage of Promoters. If you have more Promoters, the score will be positive, up to 100% (if you have 0 Detractors).

8. Customer Satisfaction Score (CSAT)
Supporting Metric
CSAT, or your Customer Satisfaction Score, is another survey metric that measures how satisfied users are with a product or company. The survey asks users to rate their satisfaction on a scale from 1 to 5. The results are then used to generate the customer satisfaction score.
How to Calculate CSAT
To calculate your CSAT score, divide the number of positive responses (4 and 5) to the CSAT survey by the total number of responses. Then, multiply the result by 100 to get a percentage value.

9. Customer Effort Score
Advanced Metric
Your Customer Effort Score reflects how customers perceive the effort required to operate or interact with your product, business, or service. Generally, CES surveys are posed immediately after the interaction for which you’re trying to gauge an effort score (such as after a customer submits a ticket, adds an integration, completes a transaction, etc).
Customer Effort Score is valuable because it reveals how much work the experience is asking the customer to do. Satisfaction can stay high for a while even in a clunky journey, especially if the team is responsive. Effort exposes the design and process issues underneath, which makes it one of the most useful metrics for finding friction before it turns into frustration or churn.
– Andrei Blaj, Managing Partner, Atta Systems
How to Calculate Customer Effort Score
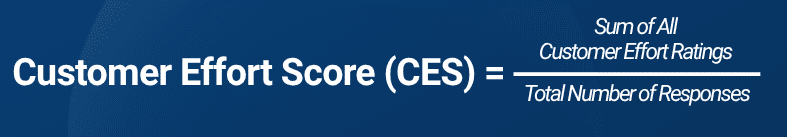
To calculate a customer effort score for a specific interaction or product, conduct a customer effort survey, then divide the sum of all the ratings by the total number of responses. You can also use formulas similar to NPS or CSAT: either subtract the percentage of bad ratings from the percentage of good ratings, or divide the number of positive responses by the total number of responses and multiply the result by 100.

10. Customer Acquisition Cost (CAC)
Supporting Metric
Customer Acquisition Cost, or CAC, measures the precise cost of acquiring a customer. While traditionally only including Sales and Marketing costs, you can add any extra costs you would consider appropriate, such as Customer Success Engineering (if you’re building custom implementations and integrations).
Customer acquisition cost becomes much more useful when you read it next to retention and expansion. A low CAC can look great until you realize you are acquiring customers who never reach value, never expand, or churn before they pay back the cost to win them. That is why CAC is not just a marketing metric, it is a business quality metric.
– Philipp Wolf, Founder & CEO, Custify
How to Calculate Customer Acquisition Cost
Your customer acquisition cost is calculated for an average customer. It’s a sum of all the costs associated with acquiring all customers, such as Sales and Marketing, that’s then divided by the number of new customers for the same period.

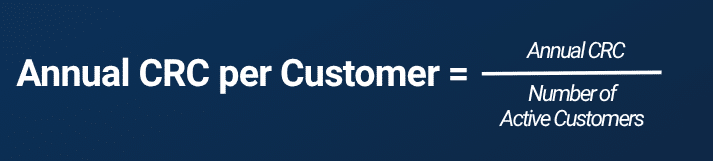
11. Customer Retention Cost (CRC)
Advanced Metric
Customer retention cost represents a complex metric that’s essentially a sum of all the retention costs within your business. These typically include account management, customer success, customer support and service, customer engagement, and any extra costs related to customer-facing activities and services.
How to Calculate Customer Retention Cost
As opposed to Customer Acquisition Costs, which are calculated per customer, Customer Retention Cost is calculated as an overall sum. You can then divide that sum by the number of customers you have to get an average cost of retaining one client.
To calculate your Customer Retention Cost (CRC), simply add together all the respective costs associated with customer retention.
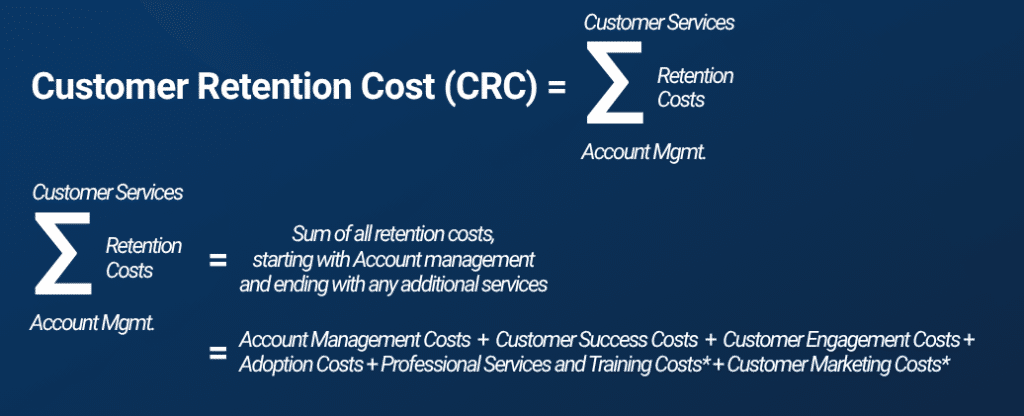
To calculate your Annual CRC per Customer, divide the CRC for that year by the total number of active customers in that year.
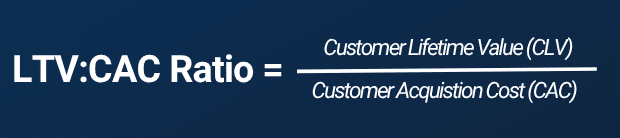
12. LTV:CAC
Advanced Metric
One of the most complex metrics in SaaS, LTV:CAC ratio is an indicator of the cost-benefit ratio of the average customer for a business. By dividing the lifetime value of that customer by the average acquisition cost, you get a clear picture of your profitability and whether you should be increasing or decreasing pricing, or decreasing customer acquisition spend. This metric is usually tracked in conjunction with the next one on this list (CAC Payback Period).
How to Calculate LTV:CAC
To calculate your LTV:CAC Ratio, divide your Customer Lifetime Value (LTV) by your Customer Acquisition Cost (CAC). The result is supposed to be a fraction, for example, 3/2, 3/1.

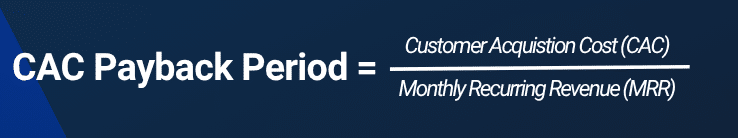
13. CAC Payback Period
Advanced Metric
CAC Payback Period is a complex metric showcasing how long it takes a business to recover the costs associated with acquiring a customer. While the concept is advanced, the formula is relatively simple and powerful. It’s generally measured together with LTV:CAC to obtain a clear picture of business profitability.
How to Calculate CAC Payback Period
To calculate your CAC Payback Period, divide your Customer Acquisition Cost by your Monthly Recurring Revenue. The result will be the number of months it takes to recoup the cost of acquiring a customer.
14. Time to Value (TTV)
Supporting Metric
Time to Value, or TTV, indicates how long it takes customers to obtain the value they expected to receive from your product or service, past the moment of sign-up. It essentially tells you how much time is needed for a user to reach their goals.
In SaaS, we also typically look at Time to First Value as a valuable customer success metric. TTFV indicates how quickly users get any sort of value from a product, service, or the business as a whole.
Time to value in first-year clients and first-year retention are big indicators of the overall success of the CS org.
– Leah Gelblat, Direct Client Experience – Amazon, at Movable Ink
The time to value for a customer is specific to their journey. What we do is identify what we call ‘moments that matter’ throughout that journey, which are defined by the KPIs specific to your customer. Within that customer journey, your customers will indicate what their moments that matter are—those things that generate value for them. Once you determine those milestones, which need to be based on SMART goals—specific, measurable, actionable, relevant, and time-bound—you can drive value for your customers.
– De’Edra Williams, Chief Customer Officer at Customer Success Revenue Frontier, during our webinar, ROI Unpacked: Proving the Revenue-driven Value of CS
How to Calculate Time to Value
TTV is not calculated as much as it is directly measured in your customer success dashboard. You can obtain an average Time to Value by adding up all the respective values for your current customers (that have reached their desired outcomes) and then dividing that number by the total number of customers. The same applies in the case of Time to First Value.
15. Time to Resolution (TTR)
Supporting Metric
Time to Resolution is an average metric indicating how long it takes for customer service interactions to be resolved. While mainly a customer service KPI, it’s also a vital customer success metric as it directly impacts customer satisfaction and churn likelihood.
Note that the accuracy of this metric relies heavily on accurately marking support requests as completed as soon as the issue has been resolved.
Time to Resolution is one of the clearest operational metrics because it shows how quickly your team can remove friction once a customer is blocked. But the useful insight is not speed alone. If TTR stays high, it usually points to something deeper, product complexity, weak internal processes, or issues that require too many handoffs to solve.
– Vlad Bodea, Co-Founder, Bento MDM
How to Calculate Time to Resolution
Unlike Time to Value, which is obtained through simple measurements, Time to Resolution is calculated by adding up the Total Resolution Time for all customer resolved support requests, and then dividing that by the number of resolved requests.


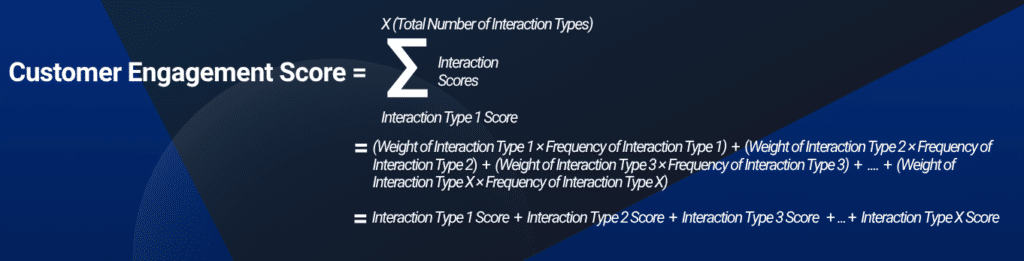
16. Customer Engagement Score
Advanced Metric
Your customer engagement score indicates how engaged customers are with your product, services, or company. It’s a complex metric that is essentially a sum of interaction scores between all the types of interactions you can identify for your customers.
For me, the engagement score is one of the most important singular measurements. It helps answer “Is this company finding value from us, and are they going to stay?” Some companies are in year 1 of a 3-year term, so you can’t measure renewal likelihood yet. Some clients can’t buy more products/services, so no new opportunities might look like a propensity for them to churn.
But if you can measure and find positive results for an Engagement Score using multiple inputs (usage, attendance, or responsiveness to training and QBRs, etc), then you can find comfort for a long-term partnership.
– Chris Otenbaker, Director of Client Success, PlanITROI
How to Calculate Your Customer Engagement Score
To calculate your customer engagement score, first determine the types of interactions your customers typically have with your business. Then, set a weight for each interaction (the more important an interaction, the higher the weight) and multiply that by the number of interactions of that type (frequency). This should get you an interaction score for each type of interaction. To get your engagement score, simply add up all the interaction scores.
17. Customer Sentiment Score
Advanced Metric
Your Customer Sentiment Score is an advanced metric that typically shows how a customer feels about your product, service, or company. Unlike other metrics on this list, sentiment scores are typically calculated through sentiment analysis tools (such as customer success platforms, customer support platforms, or dedicated sentiment analysis platforms). Such tools typically have proprietary algorithms to calculate sentiment scores based on complex analysis of all available customer signals.
Customer sentiment gives you access to signals that usage data alone will miss. A customer may still log in, attend calls, and look active on paper, while their tone, confidence, and urgency are already shifting in the wrong direction. That makes sentiment useful not just for reporting, but for catching risk earlier and understanding what kind of follow-up the account actually needs.
– Anca Radosu, Customer Success, Medicai
How to Calculate Customer Sentiment Score
Sentiment analysis relies heavily on natural language processing and is thus limited to tools that feature NLP. For more information on your options for customer sentiment scoring, see our article on sentiment analysis tools.

18. Expansion Conversion Rate / Upsell Rate
Advanced Metric
A company’s upsell rate, also known as the expansion conversion rate, measures the percentage of customers who accept upsell pitches out of all the ones who received a pitch. It’s a simple metric, but that doesn’t make it any less important, as it tells companies how effective their upselling strategy is, how good their customer success team is at identifying upsell opportunities, and how willing customers are to upgrade.
Expansion conversion rate tells you whether customers see enough value to grow with you. Teams often treat upsell as a persuasion problem, when in reality it is usually an adoption and timing problem. If customers are not consistently using the product and seeing outcomes, the offer may be well positioned and still go nowhere.
– Irina Vatafu, Head of Customer Success, Custify
How to Calculate Upsell Rate / Expansion Conversion Rate
To calculate your upsell rate, simply divide the number of customers who’ve accepted an upsell offer by the total number of customers offered an upsell. The result is multiplied by 100 to get a percentage value.

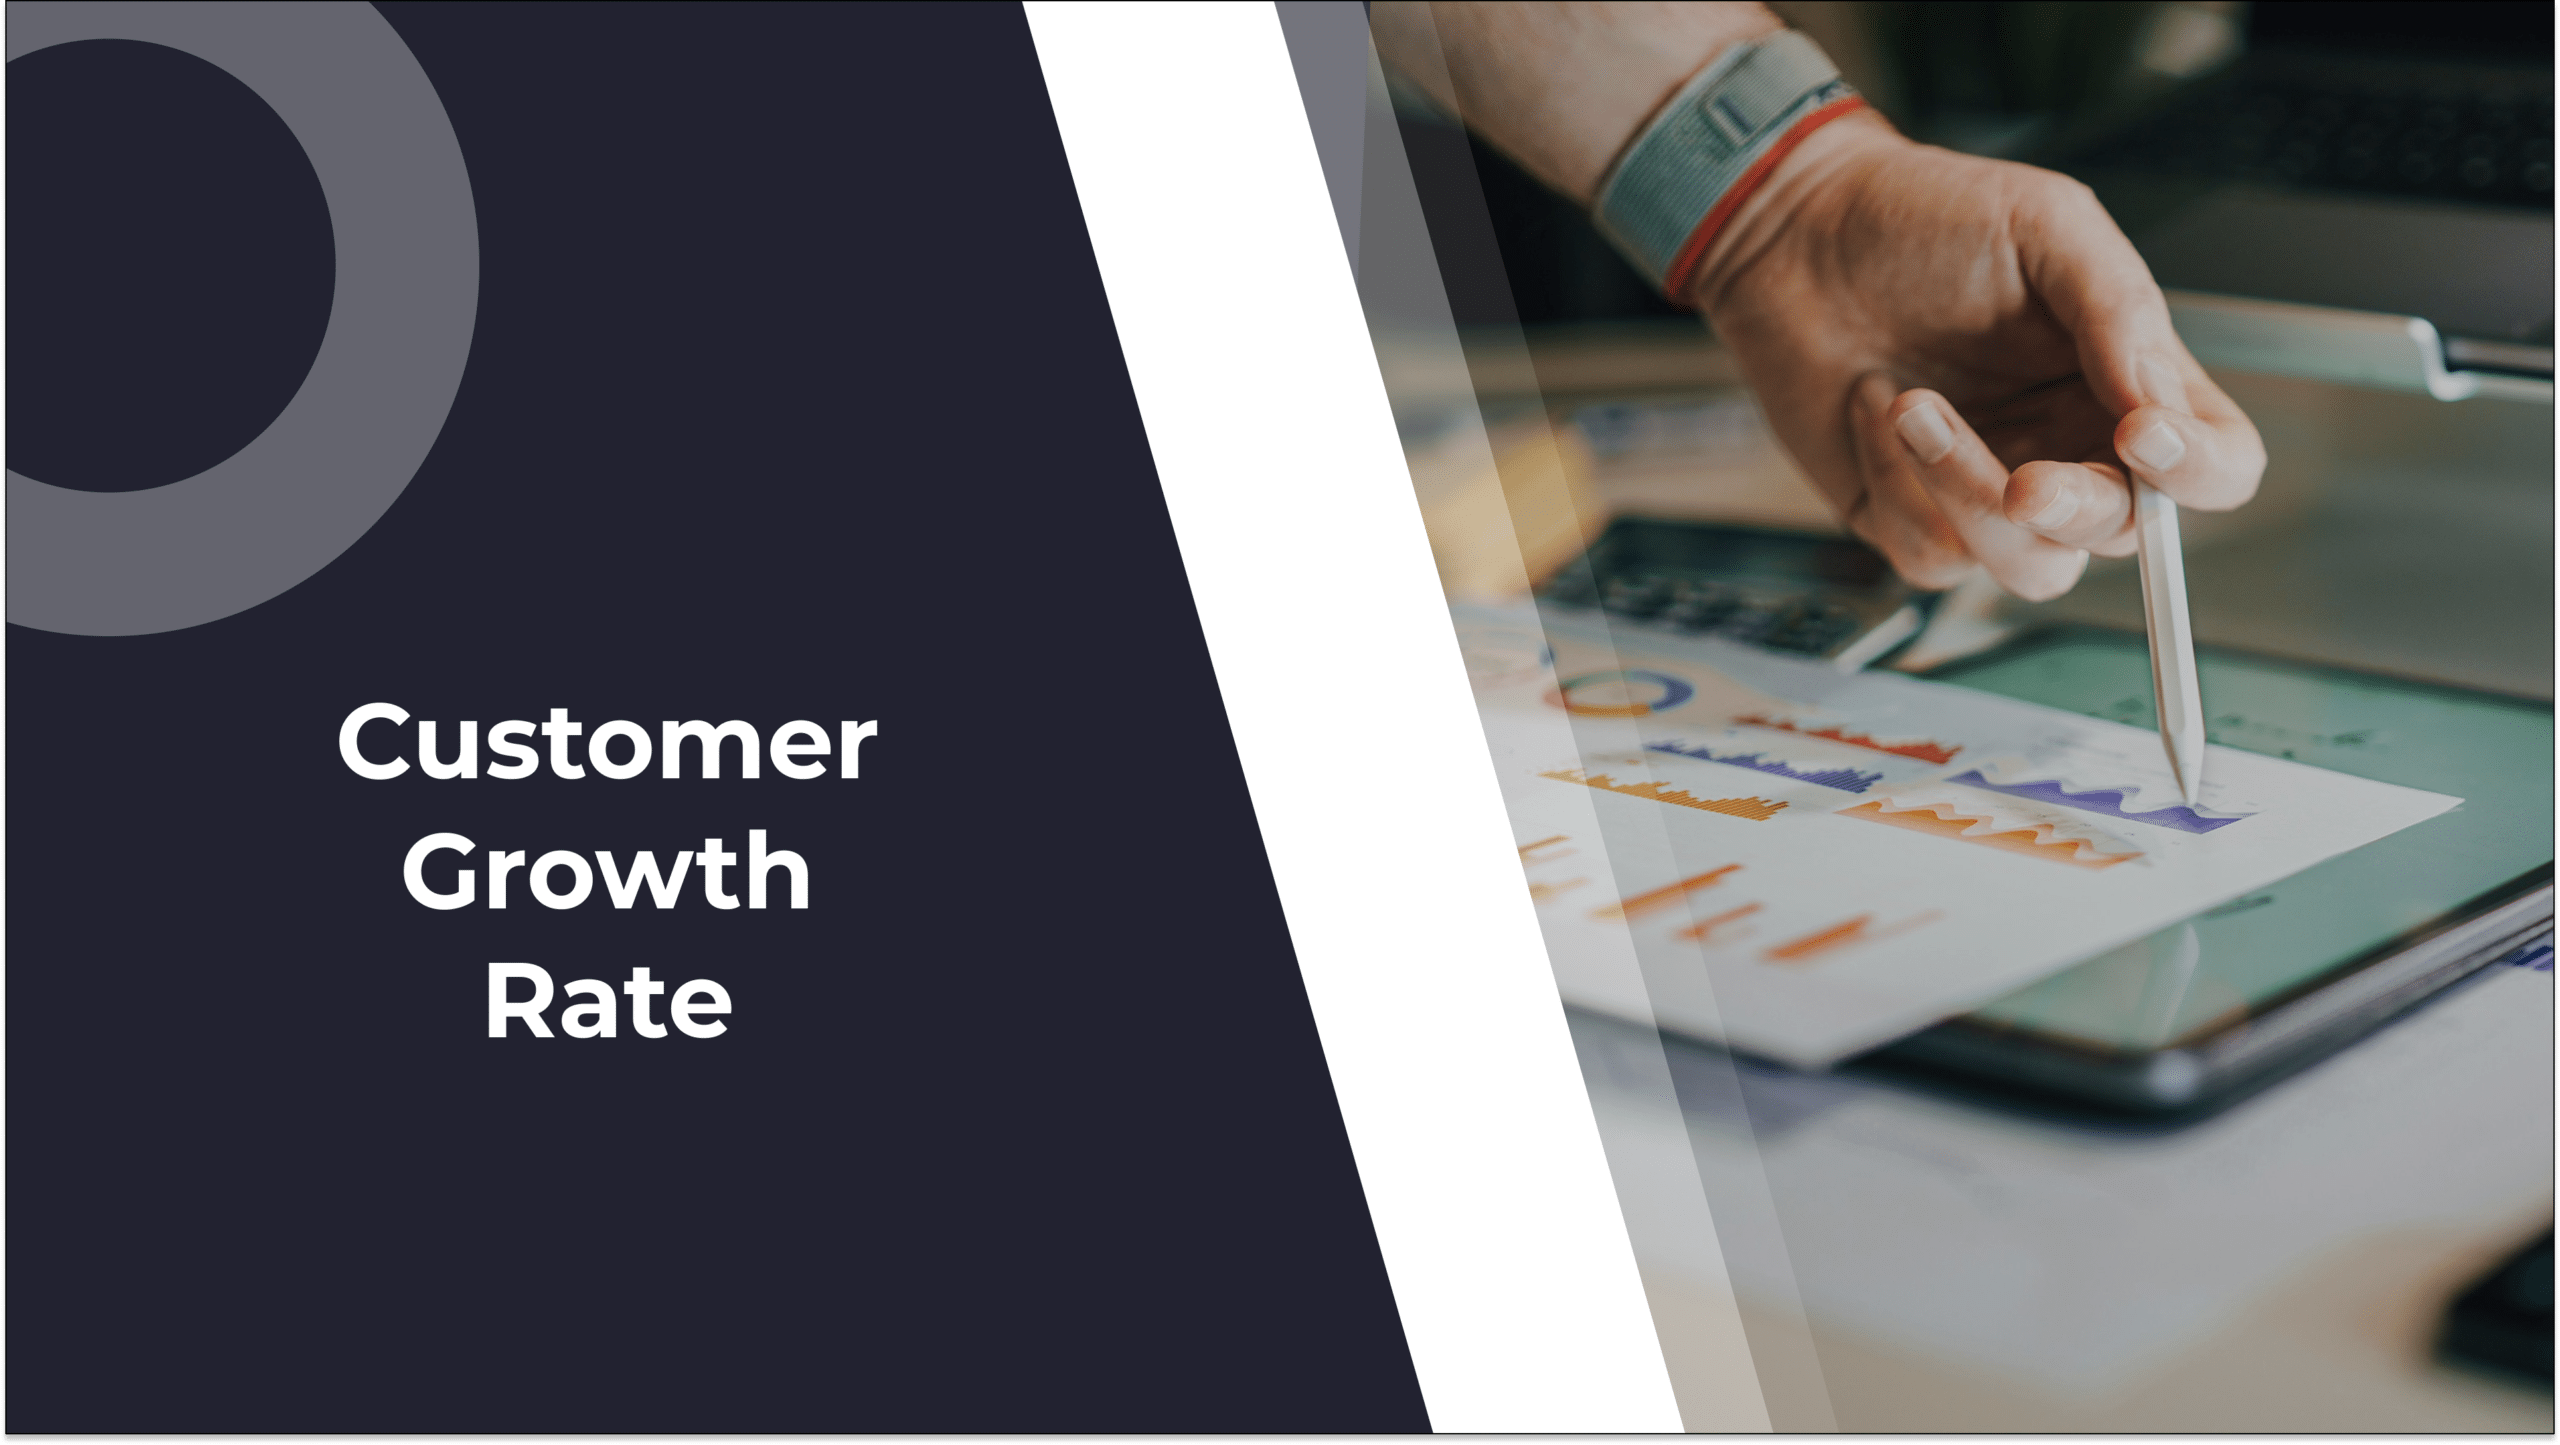
19. Customer Growth Rate (CGR)
Advanced Metric
A company’s customer growth rate is a measure of how many customers they’ve gained or lost during a specific time period, versus the number of customers they had at the beginning of that period. CGR is a key indicator of business health and a measure of how well a product is being perceived. While typically measured every quarter or year, it can also be used as a monthly metric, though the numbers may be inconclusive for such a short period.
Definitely recommend capturing retention and growth for first-year clients specifically, as well as part of the greater set of metrics being captured.
– Leah Gelblat, Direct Client Experience – Amazon, at Movable Ink
How to Calculate Customer Growth Rate
To calculate your customer growth rate, you have two options. For the basic formula, simply subtract the number of customers at the start of the period from the number of customers at the end of the period. Divide by the number of customers at the start, then multiply by 100 to get a percentage.

There’s another version of this formula, also known as the net customer growth rate, which makes it clearer that both churn and new customers are part of the equation. Note, however, that the result will be the same as the previous formula. For this one, subtract the number of customers lost during the period from the customers gained during the period, and divide by the number of customers at the start of the period. Finally, multiply by 100.

To help you out in calculating both versions of this formula, we created this simple customer growth rate calculator spreadsheet, which you can simply copy to your Google Drive and use.
Frequently Asked Questions about Customer Success Metrics
1. What are customer success metrics?
Customer success metrics are complex measurements that showcase the health of a business, particularly those in the SaaS space. Typically, CS metrics measure retention, churn, customer satisfaction, engagement, as well as recurring revenue and customer growth.
2. How do companies benchmark customer success metrics?
Benchmarking customer success metrics is done by reviewing industry reports and websites such as:
- BenchmarkIT, a website that regularly publishes SaaS performance metrics and benchmarks, such as this report for 2025.
- Other good sources for benchmarking include: Paddle’s yearly reports on benchmarks, Lenny’s newsletter, and Baremetrics.
3. What metrics should I track for customer success?
Which metrics you should track for your customer success efforts comes down to your business specifics. While most companies track churn and retention, other metrics have more to do with your KPIs and business focus. Some common ones include: MRR, ARR, NRR, GRR, customer engagement rate, NPS, and sentiment score. All the other metrics on the list above can also prove useful and provide valuable insights.
4. How to measure customer success metrics?
Measuring customer success metrics accurately is done with a customer success software, such as Custify. Within a CS platform, you can integrate all relevant data sources and set up custom dashboards to track the most relevant KPIs, customer health scores, and calculated metrics. Furthermore, most CS platforms, including Custify, let you set up automation flows to act based on specific triggers related to these customer success metrics.
Making Sure You Track the Most Important Customer Success Metrics
To ensure you’re keeping up to speed with all the most relevant developments among your customer base, Custify can help you get a handle on your data streams, create a single source of truth, and act proactively based on time-sensitive customer signals. Set up a quick 15-minute call, and our team will walk you through everything, no commitment necessary.